
Data report · Updated October 2026
Men's fashion spending statistics: households spent $374 on men's clothing in 2024
What US households spend on men's apparel, by year, age and income, from the federal Consumer Expenditure Surveys.
The average US consumer unit spent $374 on clothing for men 16 and over in 2024, down from $406 in 2023[1]. Spending on women's clothing was $632[2]. Total apparel and services spending was $2,001, about 2.5% of the $78,535 households spent overall (menhaircuts.net calculation)[3].

$374
average household spending on men's clothing (16 and over), 2024[1]
$632
average household spending on women's clothing (16 and over), 2024[2]
$723
men's clothing spending in the top income fifth, 2024[4]
$2,001
total apparel and services spending per household, 2024[3]
By Jessica Hamilton, Editor · Published · Updated · Free to reuse with credit (CC BY 4.0)
Key findings
- US consumer units spent an average of $374 on clothing for men 16 and over in 2024, down from $406 in 2023[1].
- Spending on women's clothing averaged $632 in 2024, about 1.7 times the men's figure (menhaircuts.net calculation: $632 / $374)[2][1].
- Men's clothing spending rose from $240 in 2020 to $374 in 2024, a 56% increase over four years (menhaircuts.net calculation)[1].
- Households in the top income fifth spent $723 on men's clothing in 2024, against $191 in the lowest fifth[4][5].
- By age of the household head, 45 to 54 year olds spent $500 on men's clothing in 2024 and those 65 and over spent $235[6][7].
- Average household spending on all footwear reached $461 in 2024, up from $314 in 2020[8].
- The consumer price index for men's apparel stood at 131.072 in 2024, and overall apparel prices in 2024 were essentially the same as in 1994[9].
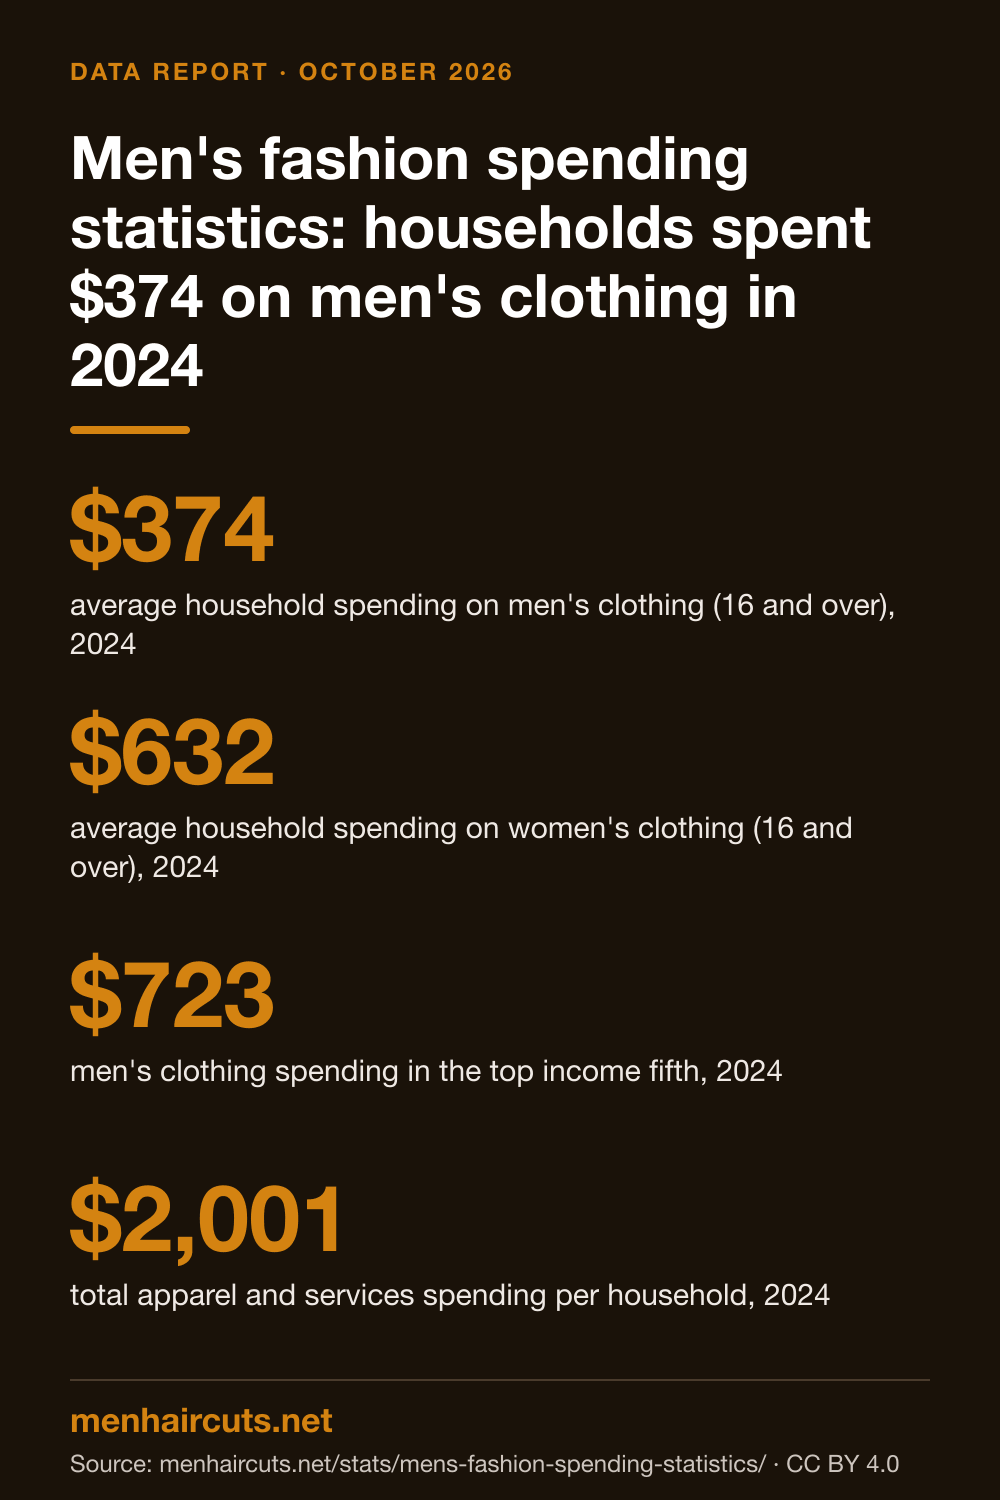
Download the infographic
The headline numbers from this report as one tall image (1000 x 1500 PNG), sized for Pinterest, slides and posts. Free to reuse with credit.
How much do American households spend on men's clothing?
The federal Consumer Expenditure Surveys put average spending on clothing for men aged 16 and over at $374 per consumer unit in 2024[1]. A consumer unit is the survey's household-level unit, and the average covers every unit, including those with no adult man, so it is lower than what a typical man who shops for himself would report.
That $374 works out to about $31 a month (menhaircuts.net calculation: $374 / 12 = $31.17)[1]. Adding boys' clothing ($92) brings the combined men's and boys' line to $467 for 2024[10][11].
These figures cover garments only. Footwear, jewelry, watches and apparel services such as dry cleaning and alterations sit in separate lines inside the wider apparel and services category, which totaled $2,001 per consumer unit in 2024[3]. For the grooming side of the budget, our haircut cost guide covers what men pay at the barber.
| Year | Men, 16+ | Women, 16+ | Boys, 2-15 | Men and boys | All apparel and services |
|---|---|---|---|---|---|
| 2020 | $240 | $456 | $86 | $326 | $1,434 |
| 2021 | $310 | $549 | $114 | $424 | $1,754 |
| 2022 | $347 | $644 | $107 | $454 | $1,945 |
| 2023 | $406 | $655 | $96 | $502 | $2,041 |
| 2024 | $374 | $632 | $92 | $467 | $2,001 |
Women, boys, men and boys, and total columns come from the matching BLS series on FRED (see sources).
Do men spend less on clothes than women?
Yes, by a wide margin in household budgets. In 2024 consumer units spent $632 on women's clothing and $374 on men's clothing[2][1]. The gap was $258 (menhaircuts.net calculation: $632 minus $374), and women's clothing spending was about 1.7 times the men's figure.
The pattern holds for shoes too. In 2023, households spent an average of $208 on women's footwear and $147 on men's footwear[9]. For children the order flips: spending on boys' clothing was $96 in 2023, slightly above the $87 spent on girls' clothing[9].
The survey records what a household buys, not who wears it or who paid. Some men's clothing is bought by partners or parents, and gifts are counted for the household that buys them, so the split should be read as spending on each category rather than spending by men.
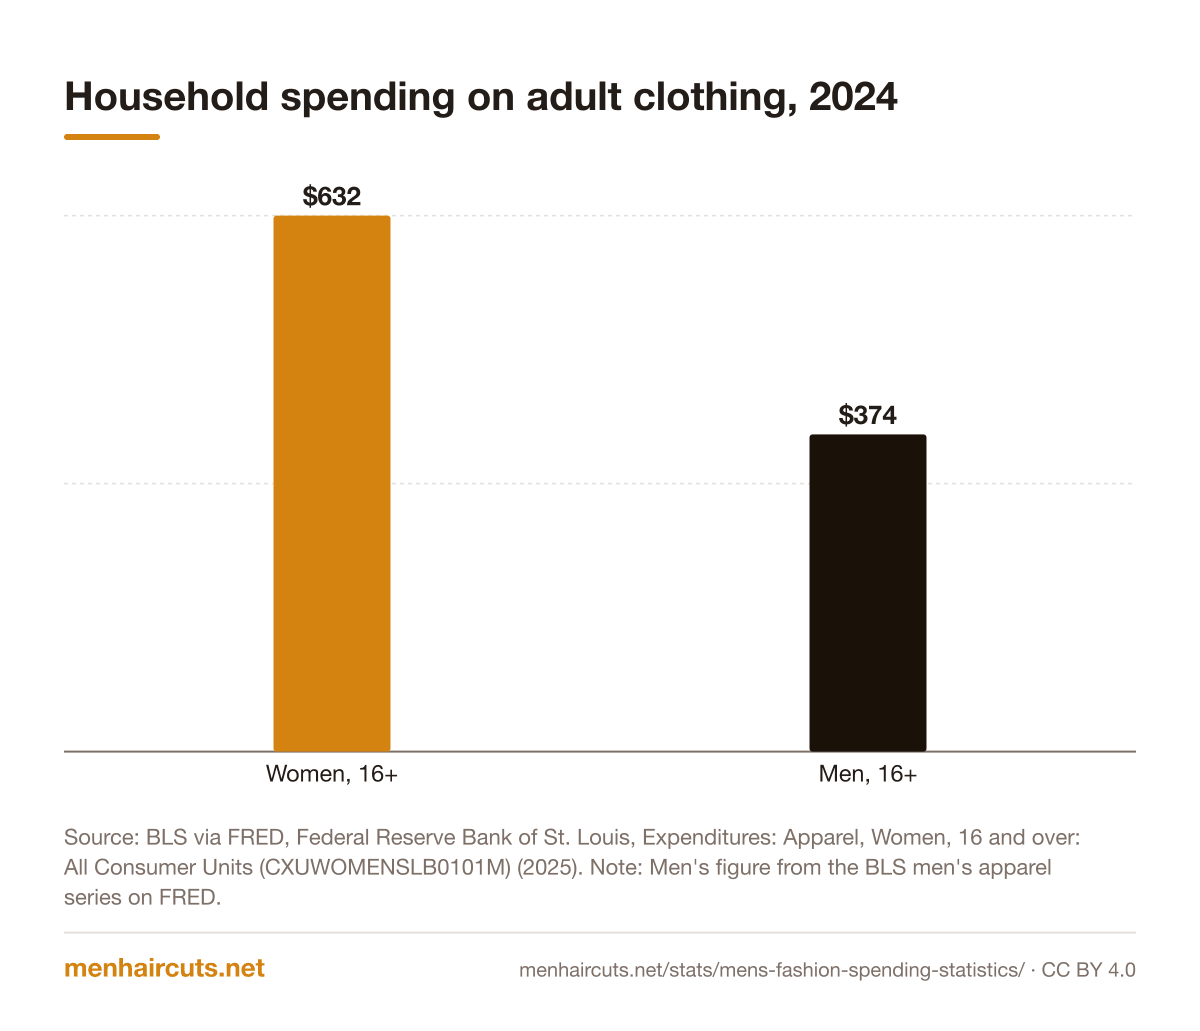
Show the numbers
| Category | Value |
|---|---|
| Women, 16+ | $632 |
| Men, 16+ | $374 |
How has men's clothing spending changed since 2020?
Spending on men's clothing fell to $240 per consumer unit in 2020[1]. It then climbed each year to $310 in 2021, $347 in 2022 and $406 in 2023[1].
In 2024 it slipped back to $374, a drop of about 7.9% from 2023 (menhaircuts.net calculation: ($374 minus $406) / $406)[1]. Total apparel and services spending also eased, from $2,041 to $2,001, a 2.0% change that the BLS did not classify as statistically significant[3]. That total had been $1,434 in 2020[12].
Across the full period, men's clothing spending rose about 56% from 2020 to 2024 (menhaircuts.net calculation: ($374 minus $240) / $240)[1]. Much of that is a rebound from an unusually low 2020 rather than a long-term surge.
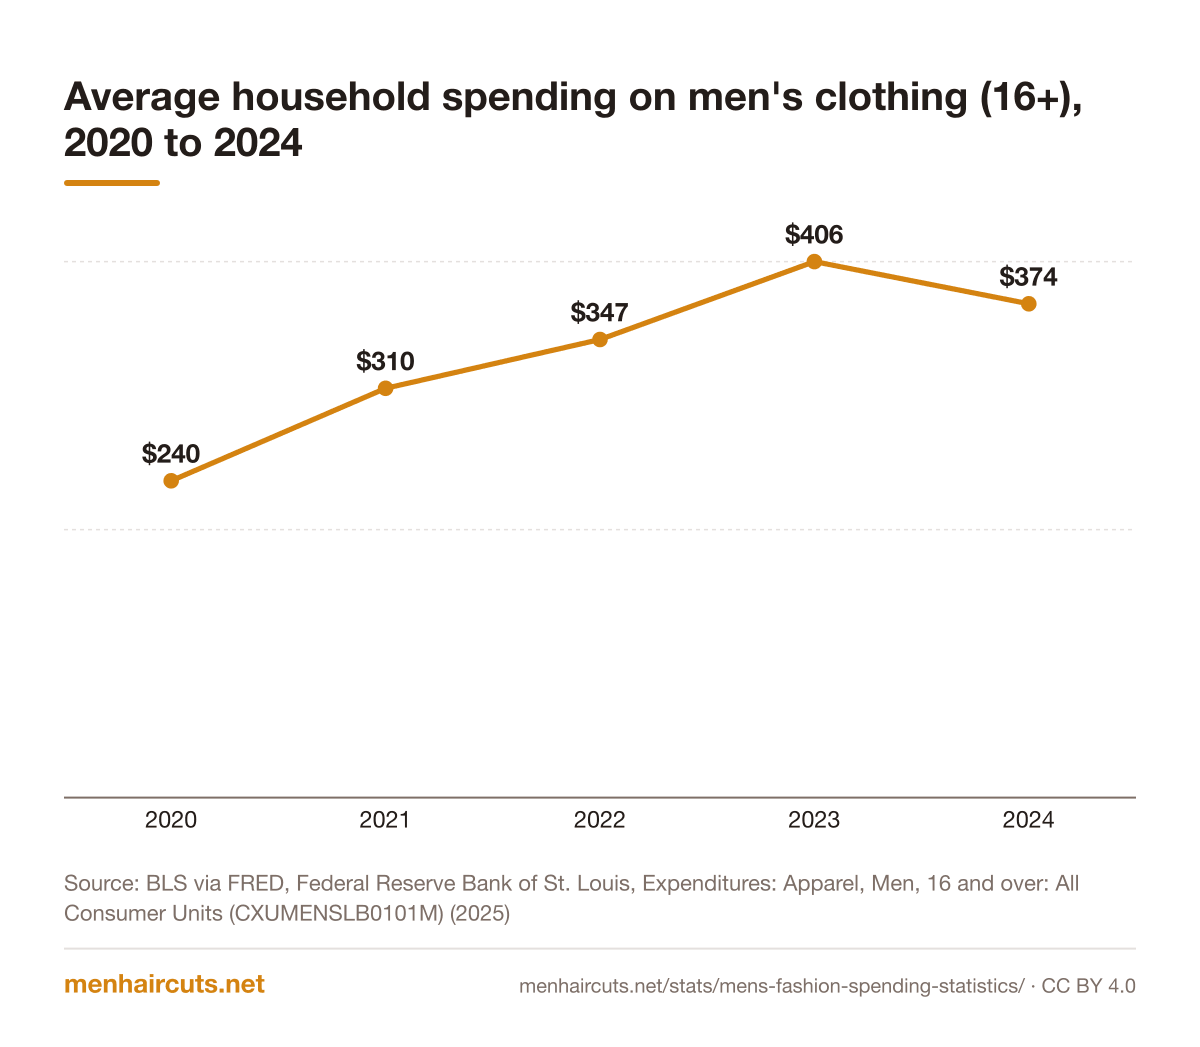
Show the numbers
| Category | Value |
|---|---|
| 2020 | $240 |
| 2021 | $310 |
| 2022 | $347 |
| 2023 | $406 |
| 2024 | $374 |
Which age group spends the most on men's clothing?
In the 2024 data, households headed by someone under 25 reported the highest men's clothing spending at $575, followed by the 45 to 54 group at $500[13][6]. Households headed by someone 65 or older spent the least, $235[7].
The under-25 figure jumped from $378 in 2023[13]. Younger households are a smaller sample in the survey, so their numbers swing more from year to year. The 45 to 54 group was more stable, at $521 in 2023 and $500 in 2024[6]. Households headed by 25 to 34 year olds spent $389 and those headed by 55 to 64 year olds spent $427[14][15].
Age here refers to the survey's reference person, not to the man wearing the clothes. A household headed by a 40-year-old may include teenage sons, which pushes up spending in the middle age bands.
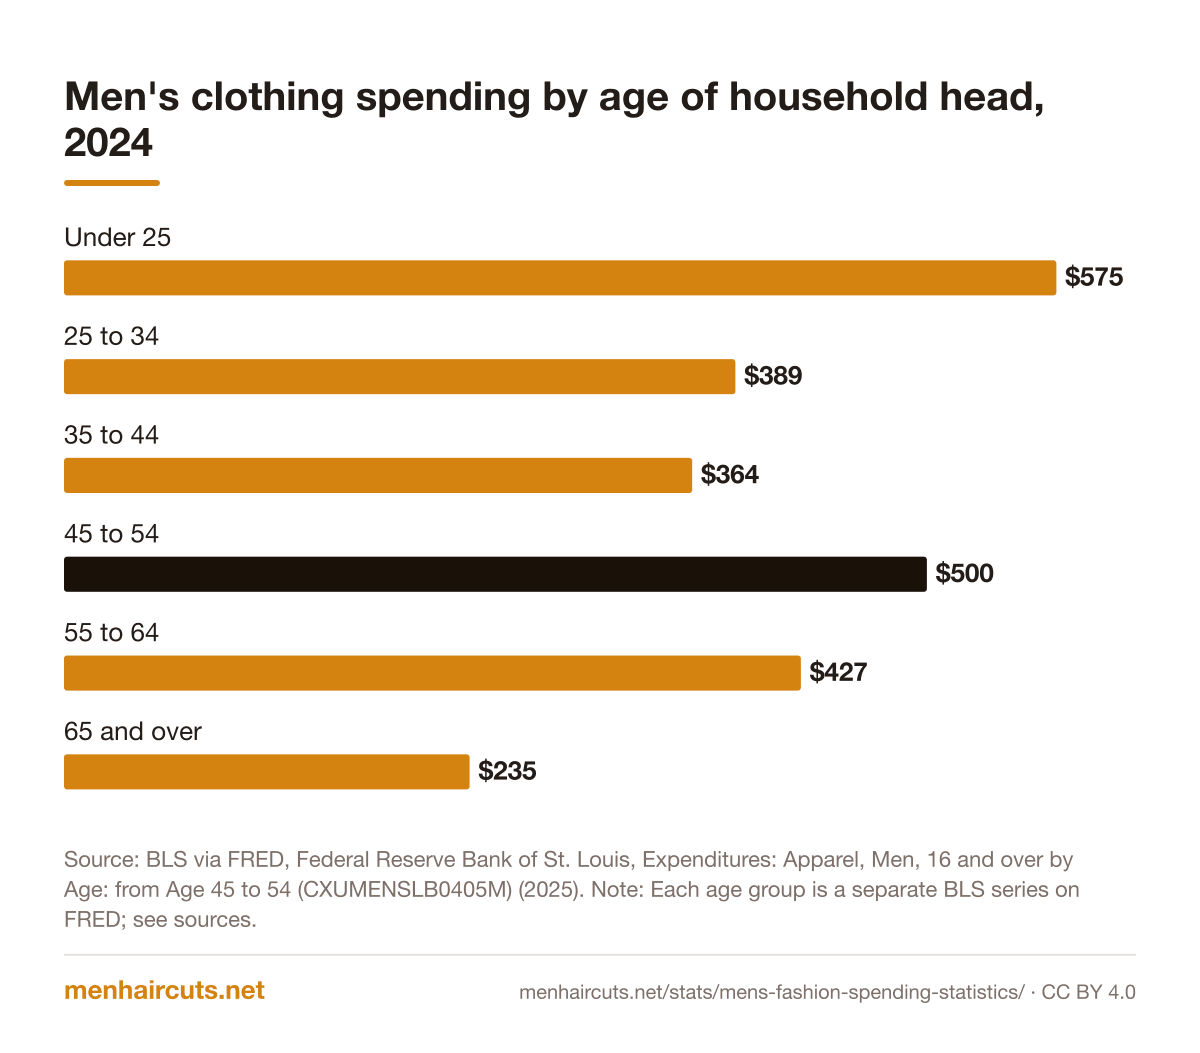
Show the numbers
| Category | Value |
|---|---|
| Under 25 | $575 |
| 25 to 34 | $389 |
| 35 to 44 | $364 |
| 45 to 54 | $500 |
| 55 to 64 | $427 |
| 65 and over | $235 |
| Age group | 2023 | 2024 |
|---|---|---|
| Under 25 | $378 | $575 |
| 25 to 34 | $465 | $389 |
| 35 to 44 | $480 | $364 |
| 45 to 54 | $521 | $500 |
| 55 to 64 | $419 | $427 |
| 65 and over | $252 | $235 |
How does income affect spending on men's clothes?
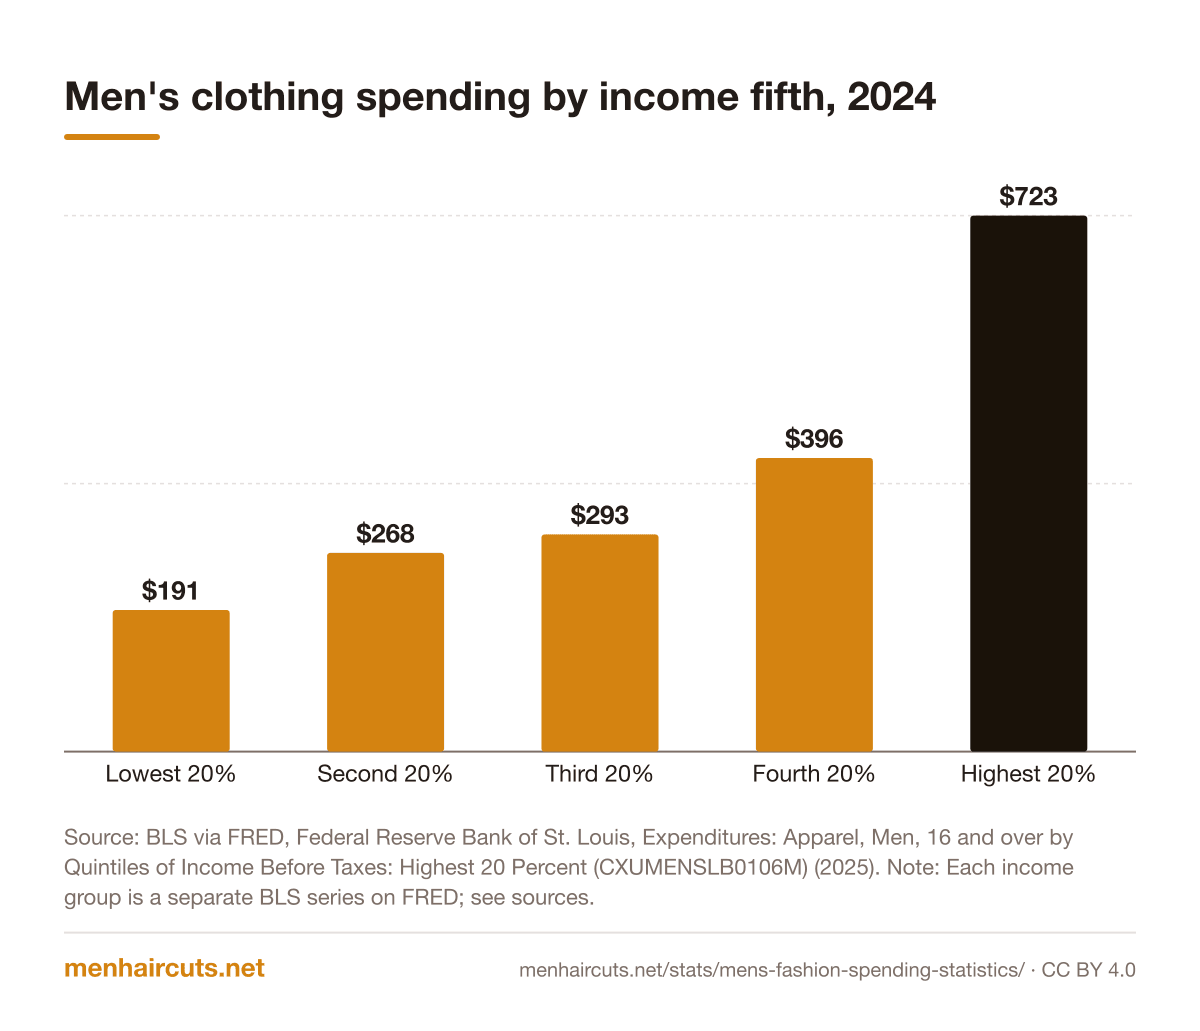
Income makes the biggest difference of any split in the data. Households in the lowest fifth of pre-tax income spent $191 on men's clothing in 2024, while those in the top fifth spent $723[5][4].
That is about 3.8 times as much at the top (menhaircuts.net calculation: $723 / $191). The middle three groups spent $268, $293 and $396[17][18][19], so the steepest climb comes between the fourth and fifth groups.
The survey does not adjust these figures for household size, so part of the gap may reflect differences in how many people live in each household.
Show the numbers
| Category | Value |
|---|---|
| Lowest 20% | $191 |
| Second 20% | $268 |
| Third 20% | $293 |
| Fourth 20% | $396 |
| Highest 20% | $723 |
How much do households spend on shoes?
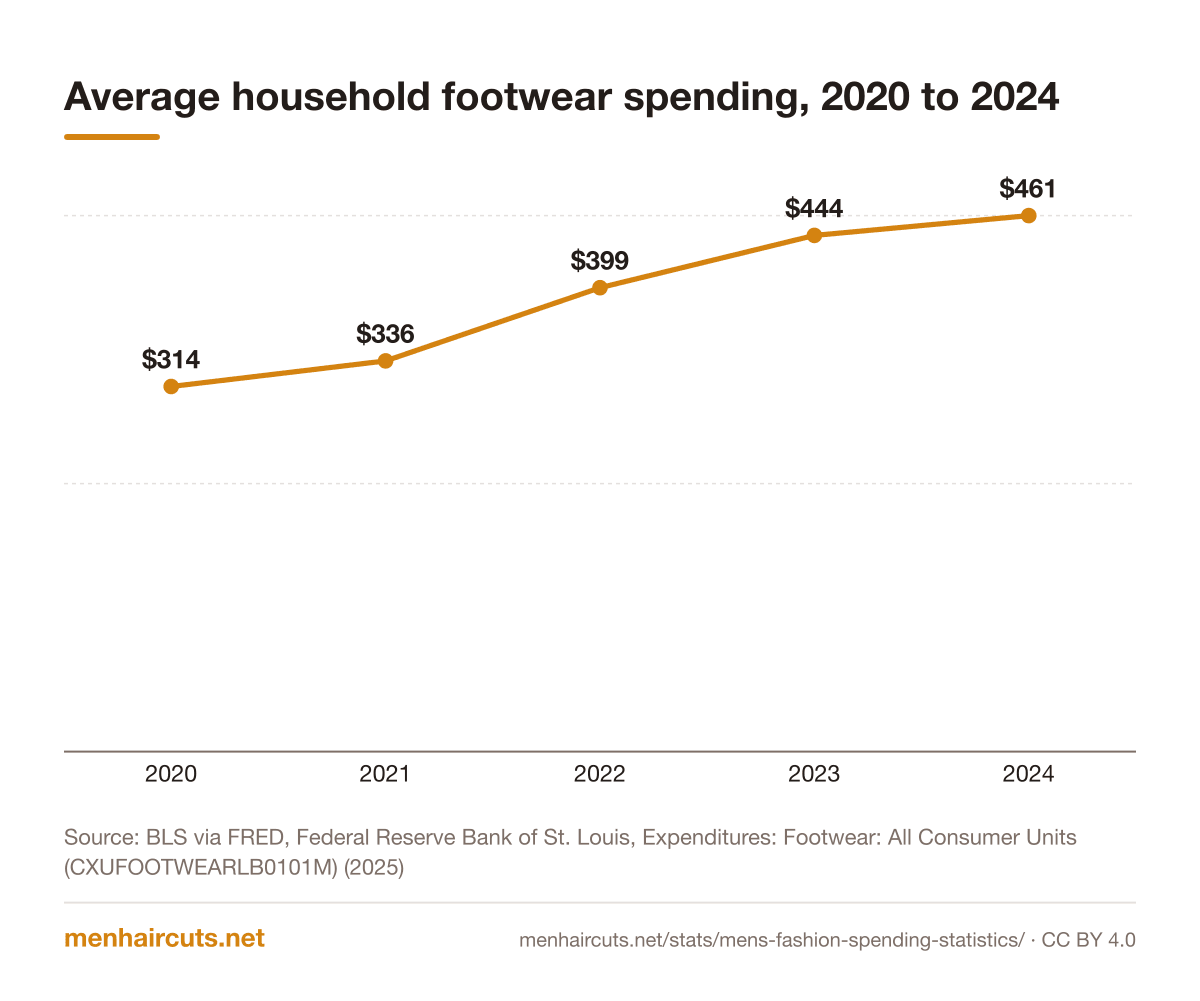
Footwear for all household members cost the average consumer unit $461 in 2024, up from $444 in 2023 and $314 in 2020[8]. Unlike clothing, footwear spending kept rising in 2024.
The most recent gender split comes from 2023, when households spent $147 on men's footwear and $208 on women's footwear[9]. Put next to the 2023 men's clothing figure of $406, men's shoes added roughly a third on top of garment spending that year (menhaircuts.net calculation: $147 / $406 = 36%)[1].
Show the numbers
| Category | Value |
|---|---|
| 2020 | $314 |
| 2021 | $336 |
| 2022 | $399 |
| 2023 | $444 |
| 2024 | $461 |
Have men's clothing prices gone up?
Much less than prices in general. The BLS consumer price index for apparel was 131.483 in 2024, while the index for all items was 313.689 (both on a 1982 to 1984 base of 100)[9]. The BLS notes that apparel prices in 2024 were essentially the same as in 1994, when the apparel index stood at 133.4[9].
The men's apparel index was 131.072 in 2024, compared with 111.131 for women's apparel and 116.689 for boys' apparel[9]. Men's footwear was higher at 151.580[9].
Flat clothing prices mean the rise in men's clothing spending since 2020 reflects more buying, or buying different items, rather than steep price increases.
| Category | Index, 2024 |
|---|---|
| All items | 313.689 |
| Apparel | 131.483 |
| Men's apparel | 131.072 |
| Women's apparel | 111.131 |
| Boys' apparel | 116.689 |
| Men's footwear | 151.580 |
| Women's footwear | 132.049 |
What share of the household budget goes to men's clothes?
A small one. Average annual expenditures per consumer unit were $78,535 in 2024[3]. Men's clothing at $374 was about 0.5% of that total (menhaircuts.net calculation: $374 / $78,535 = 0.48%)[1].
Within apparel and services, men's clothing made up about 19% of the $2,001 total (menhaircuts.net calculation: $374 / $2,001 = 18.7%)[3]. For comparison, personal care products and services, which include haircuts and grooming products, came to $978 per consumer unit in 2024[3].
If you are dressing for interviews or a new job, our guides to job interview haircuts and office haircuts cover the grooming half of the look.
Frequently asked questions
How much does the average American spend on men's clothing a year?
Do men spend less on clothing than women?
Did men's clothing spending go up or down in 2024?
Which households spend the most on men's clothes?
How much do men spend on shoes?
Are men's clothes more expensive than they used to be?
Methodology and limitations
This report uses annual data from the BLS Consumer Expenditure Surveys, read from the BLS news release for 2024 and from the BLS series republished on FRED (Federal Reserve Bank of St. Louis), last updated December 19, 2025. Men's clothing means the BLS category 'Apparel, Men, 16 and over'. Age and income splits are the separate BLS series for each age group of the reference person and each income quintile. Price data and the 2023 footwear split come from the BLS article 'Apparel data in fashion' (February 5, 2025). All shares, ratios, monthly figures and percentage changes are menhaircuts.net calculations from the cited inputs and show their formulas. Sources were accessed October 15, 2026.
Limitations
The Consumer Expenditure Surveys report averages across all consumer units, including households without an adult man, so the men's clothing figure is lower than what a typical man spends on himself. The data describe what a household bought, not who paid or who wears it. Age groups refer to the survey's reference person. Year-to-year changes for small groups, such as households headed by someone under 25, can reflect sampling variation; the BLS did not classify the 2023 to 2024 change in total apparel spending as statistically significant. Men's and women's footwear are only split out here for 2023. Figures are in current dollars and are not adjusted for inflation.
Every figure on this page links to its source. Numbers are reported as published; any menhaircuts.net calculation is labelled and shows its inputs. Spotted an error? Tell us and we will check it.
Sources
- Expenditures: Apparel, Men, 16 and over: All Consumer Units (CXUMENSLB0101M), BLS via FRED, Federal Reserve Bank of St. Louis (2025). Accessed October 15, 2026.
- Expenditures: Apparel, Women, 16 and over: All Consumer Units (CXUWOMENSLB0101M), BLS via FRED, Federal Reserve Bank of St. Louis (2025). Accessed October 15, 2026.
- Consumer Expenditures in 2024 (news release), U.S. Bureau of Labor Statistics (2025). Accessed October 15, 2026.
- Expenditures: Apparel, Men, 16 and over by Quintiles of Income Before Taxes: Highest 20 Percent (CXUMENSLB0106M), BLS via FRED, Federal Reserve Bank of St. Louis (2025). Accessed October 15, 2026.
- Expenditures: Apparel, Men, 16 and over by Quintiles of Income Before Taxes: Lowest 20 Percent (CXUMENSLB0102M), BLS via FRED, Federal Reserve Bank of St. Louis (2025). Accessed October 15, 2026.
- Expenditures: Apparel, Men, 16 and over by Age: from Age 45 to 54 (CXUMENSLB0405M), BLS via FRED, Federal Reserve Bank of St. Louis (2025). Accessed October 15, 2026.
- Expenditures: Apparel, Men, 16 and over by Age: Age 65 or over (CXUMENSLB0407M), BLS via FRED, Federal Reserve Bank of St. Louis (2025). Accessed October 15, 2026.
- Expenditures: Footwear: All Consumer Units (CXUFOOTWEARLB0101M), BLS via FRED, Federal Reserve Bank of St. Louis (2025). Accessed October 15, 2026.
- Apparel data in fashion (The Economics Daily), U.S. Bureau of Labor Statistics (2025). Accessed October 15, 2026.
- Expenditures: Apparel, Boys, 2 to 15: All Consumer Units (CXUBOYSLB0101M), BLS via FRED, Federal Reserve Bank of St. Louis (2025). Accessed October 15, 2026.
- Expenditures: Apparel, Men and Boys: All Consumer Units (CXUMENBOYSLB0101M), BLS via FRED, Federal Reserve Bank of St. Louis (2025). Accessed October 15, 2026.
- Expenditures: Apparel and Services: All Consumer Units (CXUAPPARELLB0101M), BLS via FRED, Federal Reserve Bank of St. Louis (2025). Accessed October 15, 2026.
- Expenditures: Apparel, Men, 16 and over by Age: Under Age 25 (CXUMENSLB0402M), BLS via FRED, Federal Reserve Bank of St. Louis (2025). Accessed October 15, 2026.
- Expenditures: Apparel, Men, 16 and over by Age: from Age 25 to 34 (CXUMENSLB0403M), BLS via FRED, Federal Reserve Bank of St. Louis (2025). Accessed October 15, 2026.
- Expenditures: Apparel, Men, 16 and over by Age: from Age 55 to 64 (CXUMENSLB0406M), BLS via FRED, Federal Reserve Bank of St. Louis (2025). Accessed October 15, 2026.
- Expenditures: Apparel, Men, 16 and over by Age: from Age 35 to 44 (CXUMENSLB0404M), BLS via FRED, Federal Reserve Bank of St. Louis (2025). Accessed October 15, 2026.
- Expenditures: Apparel, Men, 16 and over by Quintiles of Income Before Taxes: Second 20 Percent (CXUMENSLB0103M), BLS via FRED, Federal Reserve Bank of St. Louis (2025). Accessed October 15, 2026.
- Expenditures: Apparel, Men, 16 and over by Quintiles of Income Before Taxes: Third 20 Percent (CXUMENSLB0104M), BLS via FRED, Federal Reserve Bank of St. Louis (2025). Accessed October 15, 2026.
- Expenditures: Apparel, Men, 16 and over by Quintiles of Income Before Taxes: Fourth 20 Percent (CXUMENSLB0105M), BLS via FRED, Federal Reserve Bank of St. Louis (2025). Accessed October 15, 2026.
Cite, embed and download
This report, its charts and its infographic are free to reuse under a Creative Commons Attribution 4.0 license. Credit menhaircuts.net with a link to this page.
Cite this report (APA)
Hamilton, J. (2026, October 15). Men's Fashion Spending Statistics 2026: BLS Data. menhaircuts.net. https://menhaircuts.net/stats/mens-fashion-spending-statistics/
Link to this report
<a href="https://menhaircuts.net/stats/mens-fashion-spending-statistics/">Men's Fashion Spending Statistics 2026: BLS Data</a> (menhaircuts.net, CC BY 4.0)Share the headline number
$374: average household spending on men's clothing (16 and over), 2024 (BLS via FRED, Federal Reserve Bank of St. Louis, via menhaircuts.net/stats/mens-fashion-spending-statistics/)
Download the charts and infographic
- Household spending on adult clothing, 2024 (PNG)
- Average household spending on men's clothing (16+), 2020 to 2024 (PNG)
- Men's clothing spending by age of household head, 2024 (PNG)
- Men's clothing spending by income fifth, 2024 (PNG)
- Average household footwear spending, 2020 to 2024 (PNG)
- Infographic: Men's Fashion Spending Statistics 2026 (PNG, 1000 x 1500)
Related data
- $978Average household spending on personal care products and services, 2024Men's Grooming Spending Statistics 2026
- $6.66 billionP&G Grooming segment net sales, fiscal year ended June 30, 2025Men's Beauty Industry Statistics 2026
- $205average spent by male partners to rent ceremony attire (2024 weddings)Wedding Grooming Statistics 2026
- 39%of US men say they have a consistent skincare routine (women: 60%), 2024Men's Skincare Statistics 2026
Related guides
Make us a Preferred Source on Google
See our latest articles first in your Google Search & AI Overviews.