
Data report · Updated October 2026
How many barbershops are in the US: about 162,000, and 95% have no employees
Census Bureau and BLS counts of barbershops by state, size, revenue and year.
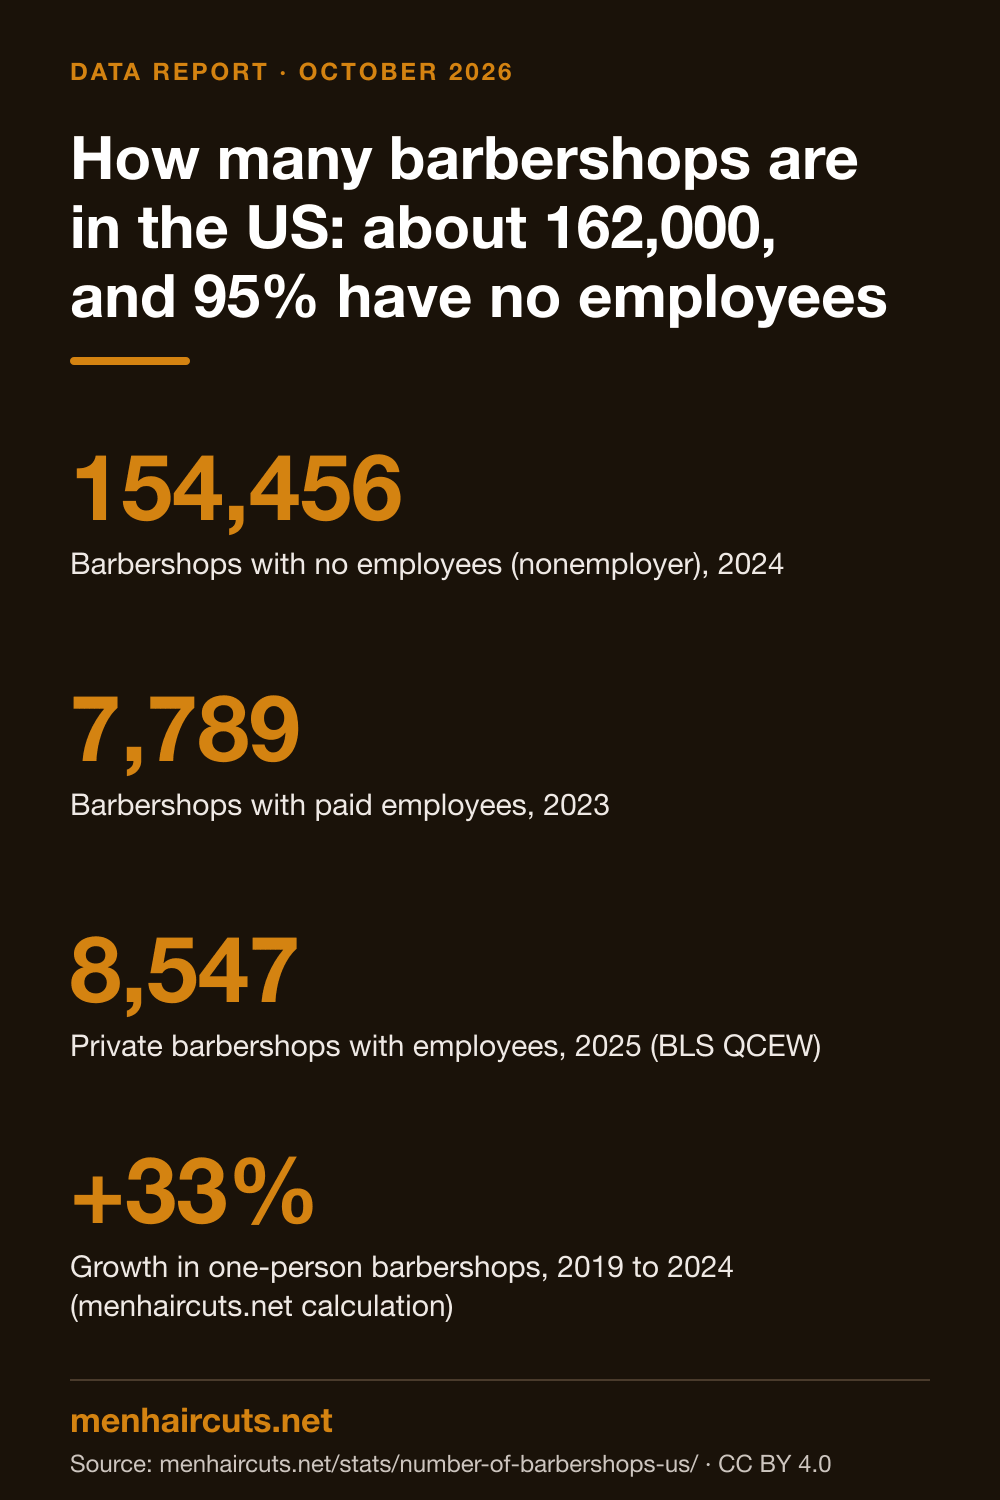
The US had 154,456 barbershops with no paid employees in 2024 and 7,789 barbershops with employees in 2023, according to the Census Bureau[1][2]. Together that is roughly 162,000, and about 95% are one-person businesses (menhaircuts.net calculation). Employer shops grew to 8,547 in 2025[3].

154,456
Barbershops with no employees (nonemployer), 2024[1]
7,789
Barbershops with paid employees, 2023[2]
8,547
Private barbershops with employees, 2025 (BLS QCEW)[3]
+33%
Growth in one-person barbershops, 2019 to 2024 (menhaircuts.net calculation)[1]
By Jessica Hamilton, Editor · Published · Updated · Free to reuse with credit (CC BY 4.0)
Key findings
- Census counted 154,456 nonemployer barbershops, businesses with no paid staff, in 2024, with $5.07 billion in receipts[1].
- A further 7,789 barbershops had paid employees in 2023, employing 29,017 people with a $976.9 million annual payroll[2].
- Nonemployer barbershops grew from 116,128 in 2019 to 154,456 in 2024, up 33.0% (menhaircuts.net calculation)[4][1].
- Barbershops with employees more than doubled between 2014 and 2025, from 4,143 to 8,547, according to BLS QCEW counts[5][3].
- California (18,630), Texas (18,621) and Florida (17,300) have the most barbershops when one-person and employer shops are combined (menhaircuts.net calculation)[1][2].
- Three in four employer barbershops (5,884 of 7,789) had fewer than 5 employees in 2023[2].
- Beauty salons still outnumber barbershops by more than five to one: 867,242 nonemployer salons in 2024 and 84,176 employer salons in 2023[1][2].
Download the infographic
The headline numbers from this report as one tall image (1000 x 1500 PNG), sized for Pinterest, slides and posts. Free to reuse with credit.
How many barbershops are there in the US?
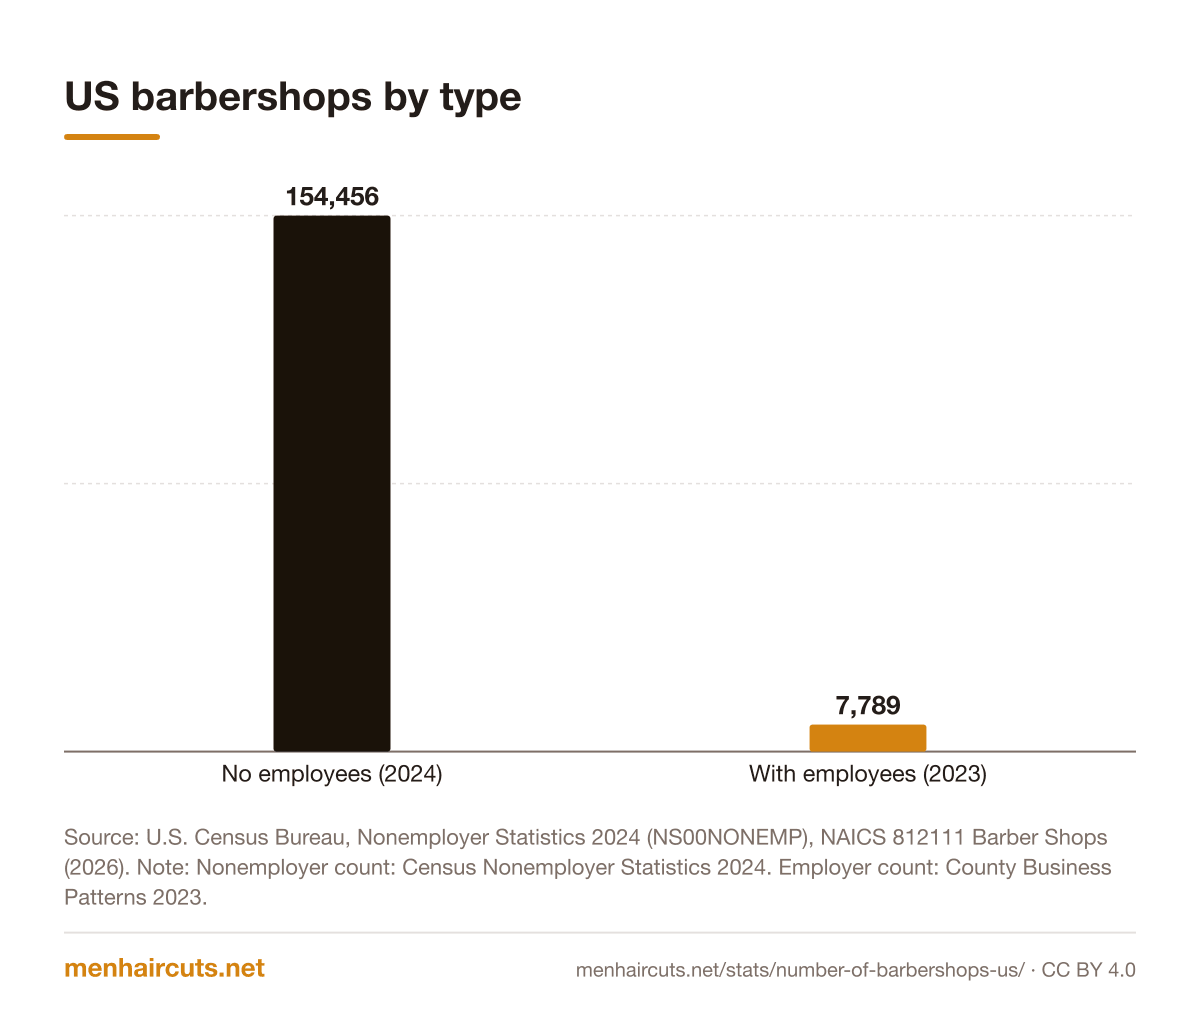
There is no single official count of barbershops, because the Census Bureau splits businesses into two groups. Nonemployer businesses have no paid staff; most are a single barber filing as a sole proprietor. In 2024 there were 154,456 nonemployer barbershops (NAICS 812111) in the US[1]. Employer businesses have at least one paid employee, and County Business Patterns counted 7,789 of those barbershop locations in 2023[2].
Adding the two gives about 162,245 barbershops (menhaircuts.net calculation: 154,456 + 7,789). That total mixes a 2024 count with a 2023 count, because the 2024 County Business Patterns had not been released at the time of writing. On that basis 95.2% of barbershops are one-person operations (menhaircuts.net calculation: 154,456 / 162,245).
A nonemployer "barbershop" is a business, not necessarily a storefront. A barber who rents a chair inside someone else's shop and files their own taxes usually shows up here as a separate nonemployer business, so the count is better read as the number of independent barbering businesses.
Show the numbers
| Category | Value |
|---|---|
| No employees (2024) | 154,456 |
| With employees (2023) | 7,789 |
Is the number of barbershops growing?
Yes, on both measures. Nonemployer barbershops rose from 116,128 in 2019 to 141,356 in 2021, 137,372 in 2022, 141,769 in 2023 and 154,456 in 2024[4][1]. The Census Bureau changed its nonemployer methods in 2022, which it says affects comparisons with earlier years, so the 2021 to 2022 dip should be read with care.
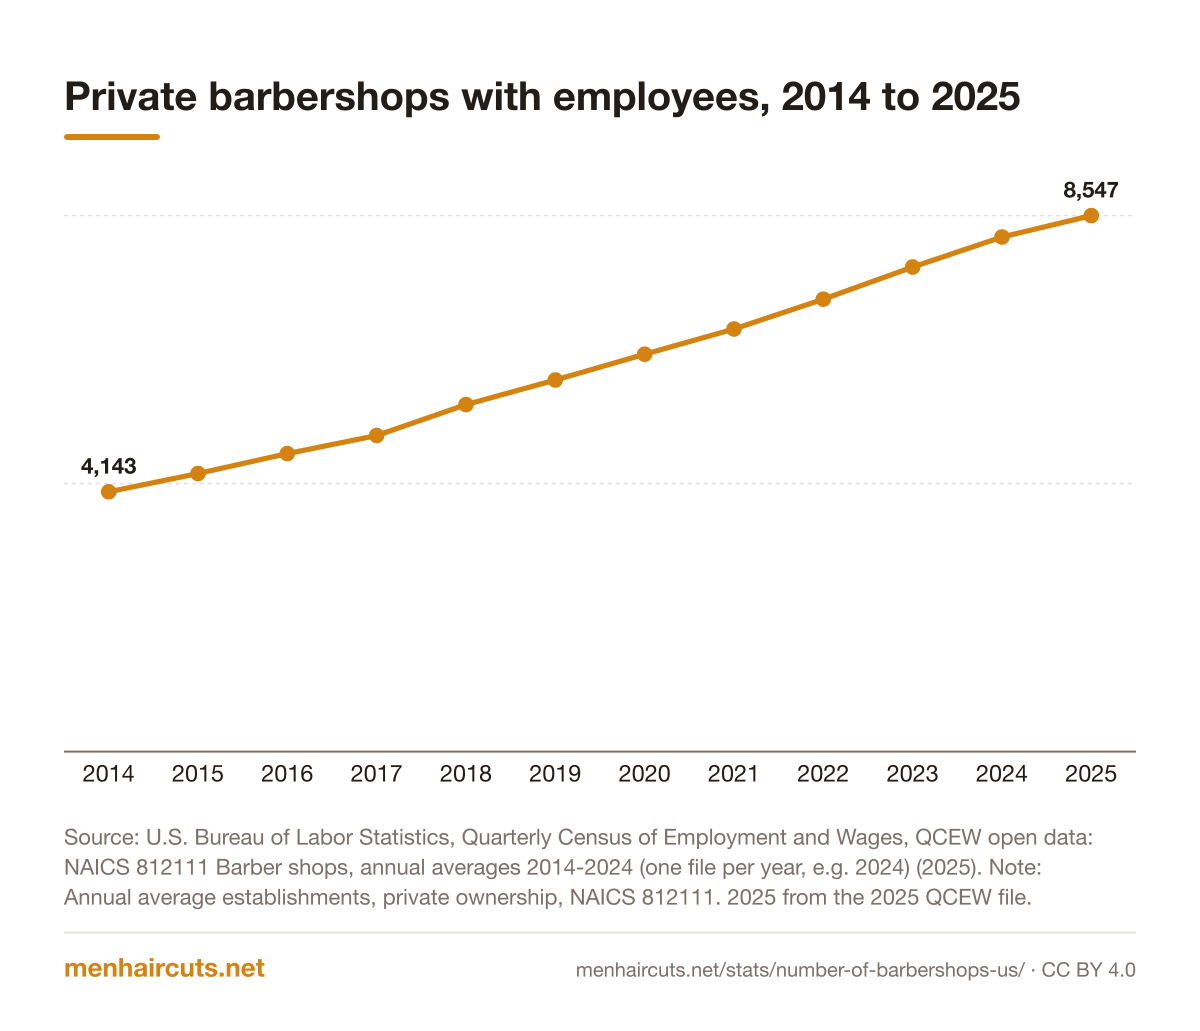
Barbershops with employees have grown every year in BLS records. The Quarterly Census of Employment and Wages counted 4,143 private barbershop establishments in 2014, 5,926 in 2019 and 8,547 in 2025[5][3]. Even 2020, when shops closed for weeks, showed an increase in establishments to 6,337, though employment fell from 30,936 to 26,034[5]. In 2025 the count rose by 342 shops, or 4.2%, over 2024[3].
Show the numbers
| Category | Value |
|---|---|
| 2014 | 4,143 |
| 2015 | 4,434 |
| 2016 | 4,752 |
| 2017 | 5,041 |
| 2018 | 5,534 |
| 2019 | 5,926 |
| 2020 | 6,337 |
| 2021 | 6,739 |
| 2022 | 7,214 |
| 2023 | 7,728 |
| 2024 | 8,205 |
| 2025 | 8,547 |
How many barbershops are in each state?
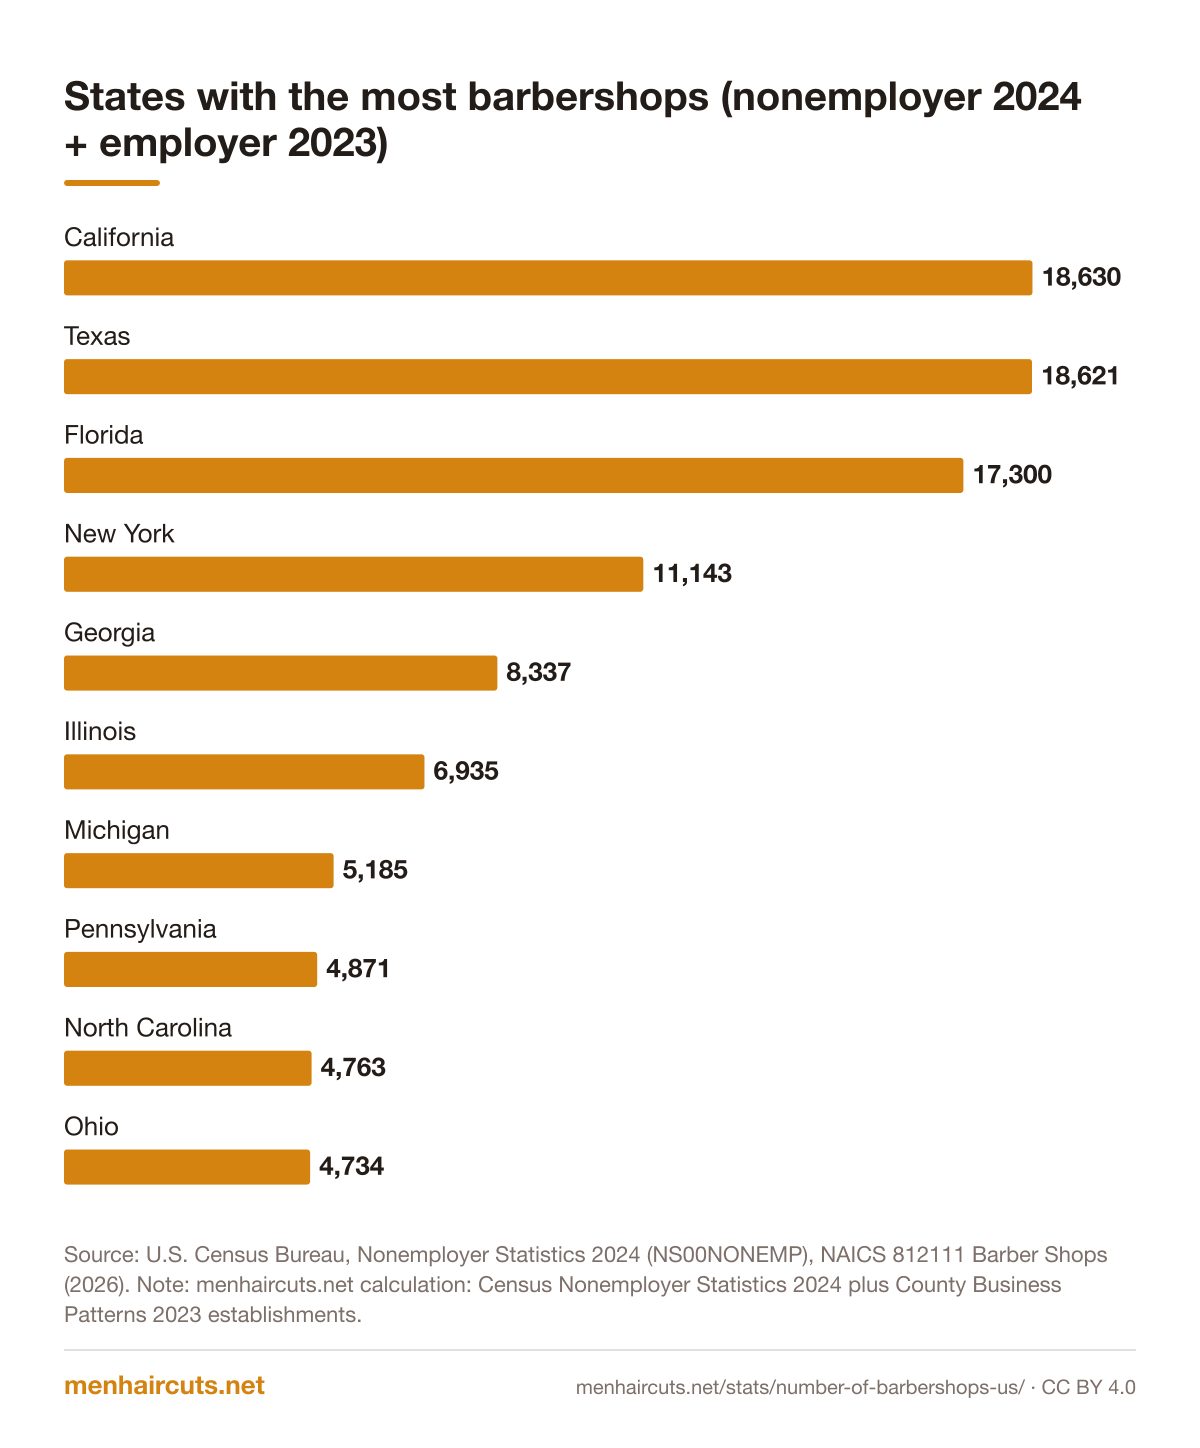
California, Texas and Florida each have more than 17,000 barbershops when both types are counted, and New York has more than 11,000 (menhaircuts.net calculation from Census counts)[1][2]. New York has the most employer barbershops, 1,000, ahead of Florida's 808[2]. Texas leads on barbershop jobs, with 3,693 employees at employer shops[2].
Georgia is the largest by count: 8,125 nonemployer barbershops, the fifth most of any state[1]. At the small end, Vermont had 93 nonemployer and 8 employer barbershops, and Wyoming had 120 and 5[1][2].
Show the numbers
| Category | Value |
|---|---|
| California | 18,630 |
| Texas | 18,621 |
| Florida | 17,300 |
| New York | 11,143 |
| Georgia | 8,337 |
| Illinois | 6,935 |
| Michigan | 5,185 |
| Pennsylvania | 4,871 |
| North Carolina | 4,763 |
| Ohio | 4,734 |
| Rank | State | No employees (2024) | With employees (2023) | Combined | Employees at employer shops (2023) |
|---|---|---|---|---|---|
| 1 | California | 18,036 | 594 | 18,630 | 2,273 |
| 2 | Texas | 18,016 | 605 | 18,621 | 3,693 |
| 3 | Florida | 16,492 | 808 | 17,300 | 1,620 |
| 4 | New York | 10,143 | 1,000 | 11,143 | 2,332 |
| 5 | Georgia | 8,125 | 212 | 8,337 | 710 |
| 6 | Illinois | 6,641 | 294 | 6,935 | 1,029 |
| 7 | Michigan | 4,997 | 188 | 5,185 | 597 |
| 8 | Pennsylvania | 4,570 | 301 | 4,871 | 954 |
| 9 | North Carolina | 4,569 | 194 | 4,763 | 821 |
| 10 | Ohio | 4,580 | 154 | 4,734 | 824 |
| 11 | New Jersey | 3,574 | 560 | 4,134 | 1,589 |
| 12 | Tennessee | 3,990 | 115 | 4,105 | 642 |
| 13 | Louisiana | 3,670 | 64 | 3,734 | 260 |
| 14 | Virginia | 3,319 | 260 | 3,579 | 973 |
| 15 | Arizona | 3,331 | 206 | 3,537 | 647 |
| 16 | Massachusetts | 2,938 | 164 | 3,102 | 398 |
| 17 | Maryland | 2,725 | 129 | 2,854 | 562 |
| 18 | South Carolina | 2,666 | 98 | 2,764 | 362 |
| 19 | Indiana | 2,580 | 126 | 2,706 | 533 |
| 20 | Alabama | 2,636 | 55 | 2,691 | 254 |
| 21 | Mississippi | 2,329 | 28 | 2,357 | 114 |
| 22 | Missouri | 2,006 | 127 | 2,133 | 622 |
| 23 | Washington | 1,906 | 192 | 2,098 | 1,291 |
| 24 | Colorado | 1,695 | 189 | 1,884 | 1,179 |
| 25 | Nevada | 1,768 | 64 | 1,832 | 189 |
| 26 | Kentucky | 1,614 | 47 | 1,661 | 160 |
| 27 | Connecticut | 1,548 | 79 | 1,627 | 206 |
| 28 | Wisconsin | 1,402 | 133 | 1,535 | 668 |
| 29 | Oklahoma | 1,296 | 60 | 1,356 | 318 |
| 30 | Arkansas | 1,264 | 36 | 1,300 | 155 |
| 31 | Minnesota | 1,144 | 88 | 1,232 | 317 |
| 32 | Utah | 1,124 | 105 | 1,229 | 454 |
| 33 | Oregon | 1,002 | 85 | 1,087 | 464 |
| 34 | Kansas | 829 | 44 | 873 | 205 |
| 35 | New Mexico | 786 | 33 | 819 | 131 |
| 36 | Iowa | 621 | 28 | 649 | 102 |
| 37 | Idaho | 546 | 33 | 579 | 241 |
| 38 | Rhode Island | 547 | 27 | 574 | 44 |
| 39 | New Hampshire | 486 | 26 | 512 | 96 |
| 40 | Nebraska | 437 | 35 | 472 | 155 |
| 41 | West Virginia | 436 | 17 | 453 | 97 |
| 42 | Hawaii | 369 | 48 | 417 | 178 |
| 43 | Maine | 331 | 20 | 351 | 85 |
| 44 | Delaware | 318 | 31 | 349 | 123 |
| 45 | District of Columbia | 214 | 15 | 229 | 88 |
| 46 | Montana | 202 | 17 | 219 | 67 |
| 47 | Alaska | 152 | 14 | 166 | 51 |
| 48 | North Dakota | 136 | 20 | 156 | 83 |
| 49 | South Dakota | 137 | 8 | 145 | 15 |
| 50 | Wyoming | 120 | 5 | 125 | 24 |
| 51 | Vermont | 93 | 8 | 101 | 22 |
How big is the average barbershop?
Small. Of the 7,789 employer barbershops in 2023, 5,884 (75.5%) had fewer than 5 employees and another 1,125 had 5 to 9[2]. Only 12 had 50 or more[2]. The average employer shop had 3.7 employees (menhaircuts.net calculation: 29,017 employees / 7,789 establishments).
Most employer shops are organized as S corporations (4,279), followed by sole proprietorships (1,332), partnerships (1,093) and C corporations (1,079)[2]. Among nonemployer barbershops, 147,118 of 154,456 were individual proprietorships in 2024[1].
| Employees | Barbershops | Share (menhaircuts.net calculation) |
|---|---|---|
| Fewer than 5 | 5,884 | 75.5% |
| 5 to 9 | 1,125 | 14.4% |
| 10 to 19 | 610 | 7.8% |
| 20 to 49 | 158 | 2.0% |
| 50 to 99 | 9 | 0.1% |
| 100 to 249 | 3 | <0.1% |
How much revenue does a barbershop make?
Nonemployer barbershops took in $5.07 billion in 2024, or about $32,831 per business on average (menhaircuts.net calculation: $5,070,906,000 / 154,456)[1]. Most are small: 86,427, or 56.0%, reported receipts under $25,000, and only 6,917, or 4.5%, reported $100,000 or more (menhaircuts.net calculations)[1].
Barbershops with employees brought in $2.25 billion in revenue in 2024, up from $1.41 billion in 2019, according to the Census Bureau's Annual Integrated Economic Survey[6].
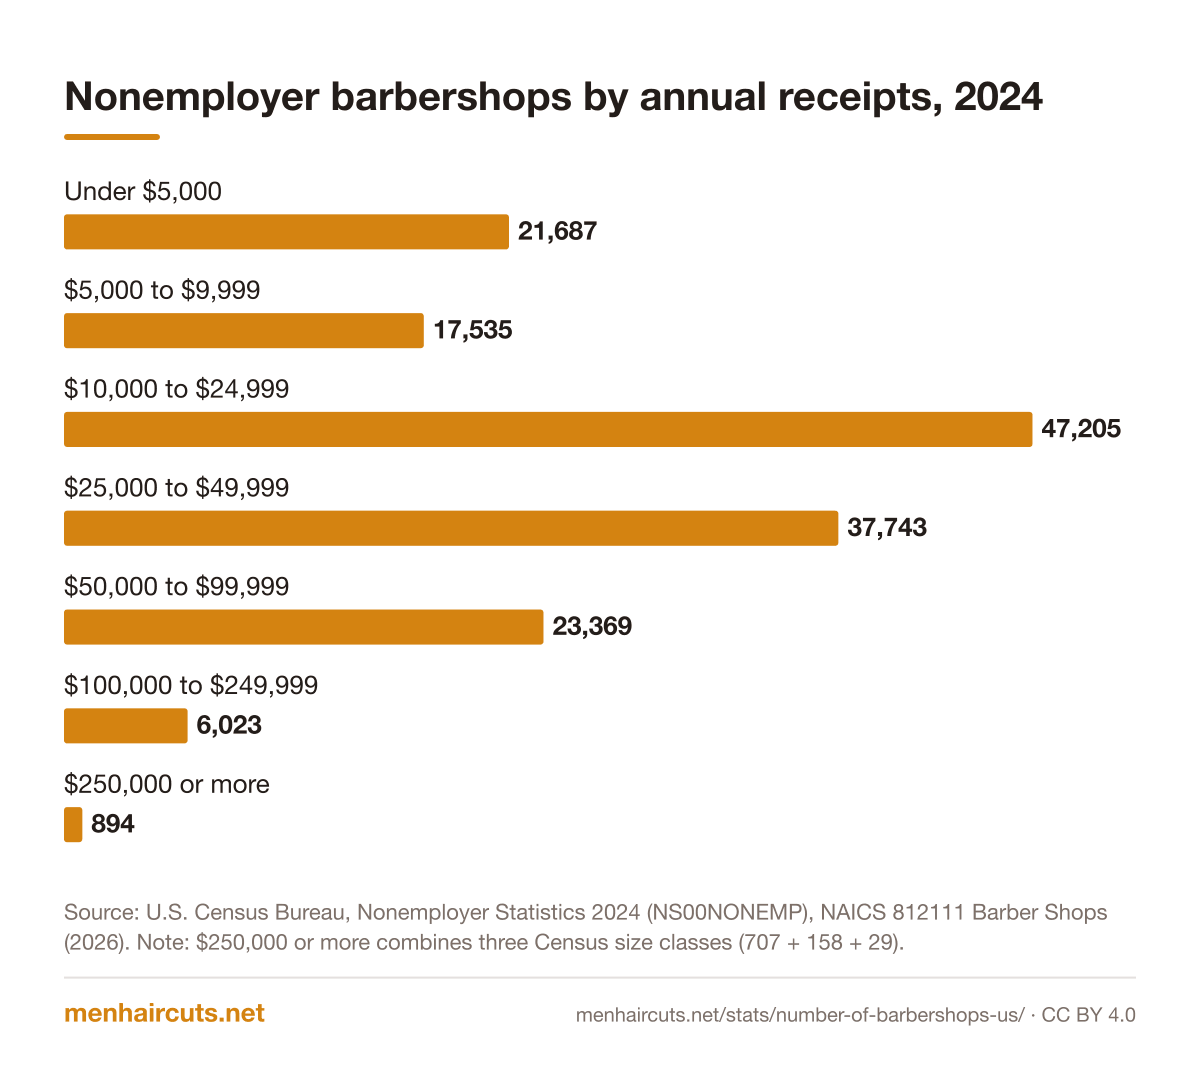
Show the numbers
| Category | Value |
|---|---|
| Under $5,000 | 21,687 |
| $5,000 to $9,999 | 17,535 |
| $10,000 to $24,999 | 47,205 |
| $25,000 to $49,999 | 37,743 |
| $50,000 to $99,999 | 23,369 |
| $100,000 to $249,999 | 6,023 |
| $250,000 or more | 894 |
Are there more barbershops or hair salons?
Hair and beauty salons are far more numerous. Census counted 867,242 nonemployer beauty salons in 2024 and 84,176 employer beauty salons in 2023[1][2]. That makes employer salons about 10.8 times as common as employer barbershops (menhaircuts.net calculation: 84,176 / 7,789).
The trend favors barbershops, though. In 2025 the number of private beauty salons with employees fell by 432, or 0.6%, to 77,449, while barbershops with employees grew 4.2% to 8,547[7][3]. For the differences in service, see our guide to barbershops vs hair salons.
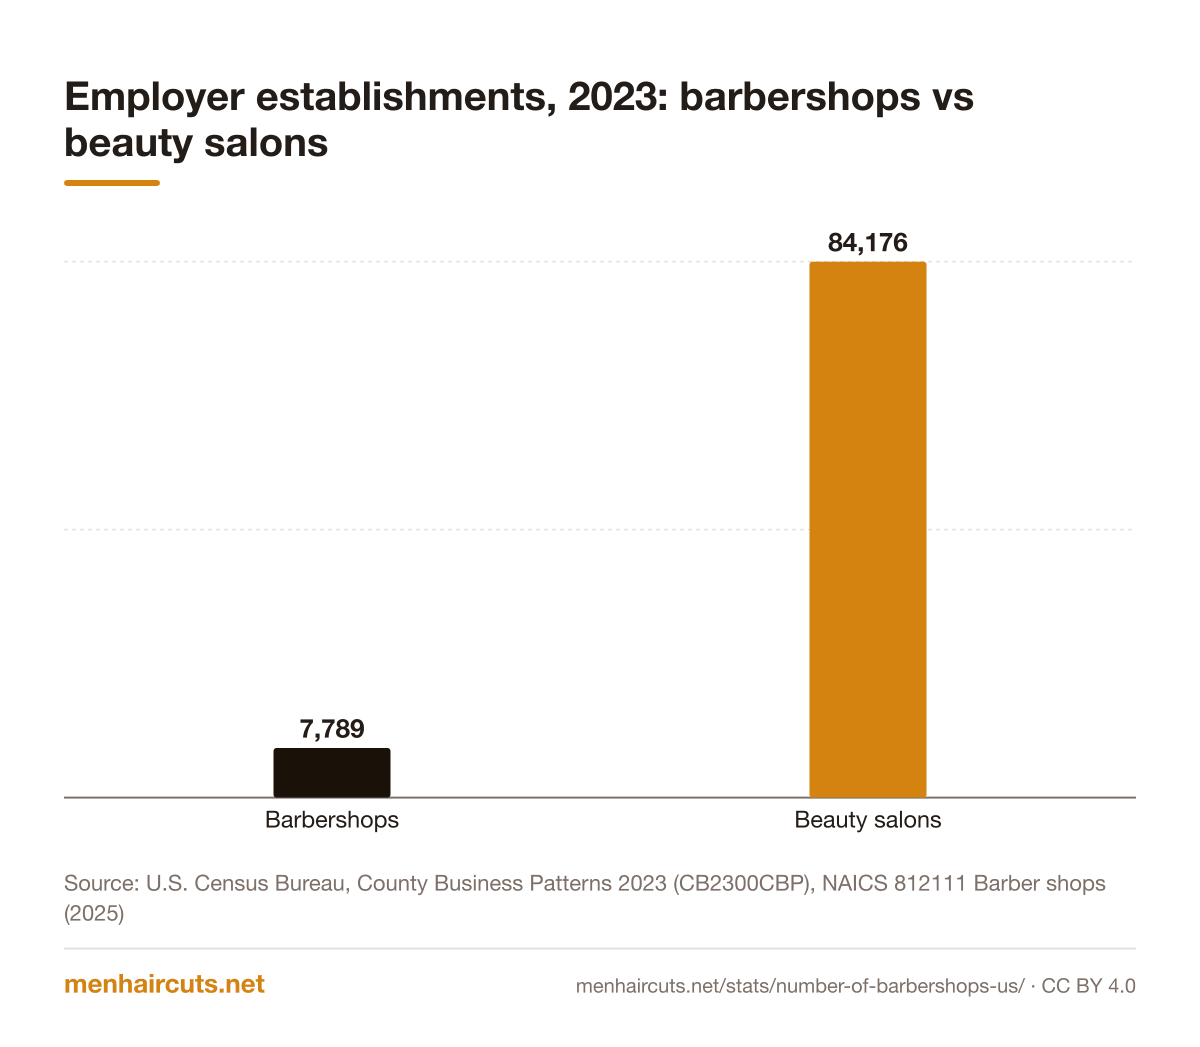
Show the numbers
| Category | Value |
|---|---|
| Barbershops | 7,789 |
| Beauty salons | 84,176 |
Which states are adding barbershops fastest?
BLS QCEW data shows where employer barbershops grew between 2024 and 2025. In raw numbers, California added 65 shops, New York 48, Texas 41 and Florida 36[3]. In percentage terms the fastest growth came in smaller markets: Oklahoma's count rose 35.6%, from 59 to 80 shops, and Arkansas grew 17.9%[3].
A few states lost employer shops. North Carolina fell by 22 (9.8%), New Jersey by 13 (2.5%) and New Hampshire by 5 (17.2%)[3]. A drop in employer shops does not always mean barbers are leaving. When owners switch staff from payroll to booth rental, a shop can move out of the employer count and its barbers reappear as nonemployer businesses.
| State | Barbershops, 2025 | Change from 2024 | Percent change |
|---|---|---|---|
| California | 726 | +65 | +9.8% |
| New York | 1,002 | +48 | +5.0% |
| Texas | 767 | +41 | +5.6% |
| Florida | 884 | +36 | +4.2% |
| Oklahoma | 80 | +21 | +35.6% |
| Michigan | 177 | +21 | +13.5% |
| New Jersey | 502 | -13 | -2.5% |
| North Carolina | 202 | -22 | -9.8% |
What happened to barbershops during COVID-19?
The pandemic hit barbershop jobs and revenue harder than the number of shops. Employment at private barbershops fell from 30,936 in 2019 to 26,034 in 2020, a 15.8% drop (menhaircuts.net calculation), yet the number of employer establishments still rose from 5,926 to 6,337[5]. Revenue at employer barbershops fell from $1.41 billion in 2019 to $1.06 billion in 2020, down 24.7% (menhaircuts.net calculation)[6].
Recovery was quick. Employer barbershop employment passed its 2019 level in 2023 at 33,534 and reached 35,340 in 2025[5][3]. Revenue reached $1.92 billion in 2023 and $2.25 billion in 2024[6]. Nonemployer barbershops rose from 116,128 in 2019 to 141,356 in 2021, which suggests many barbers went independent during and after the shutdowns[4].
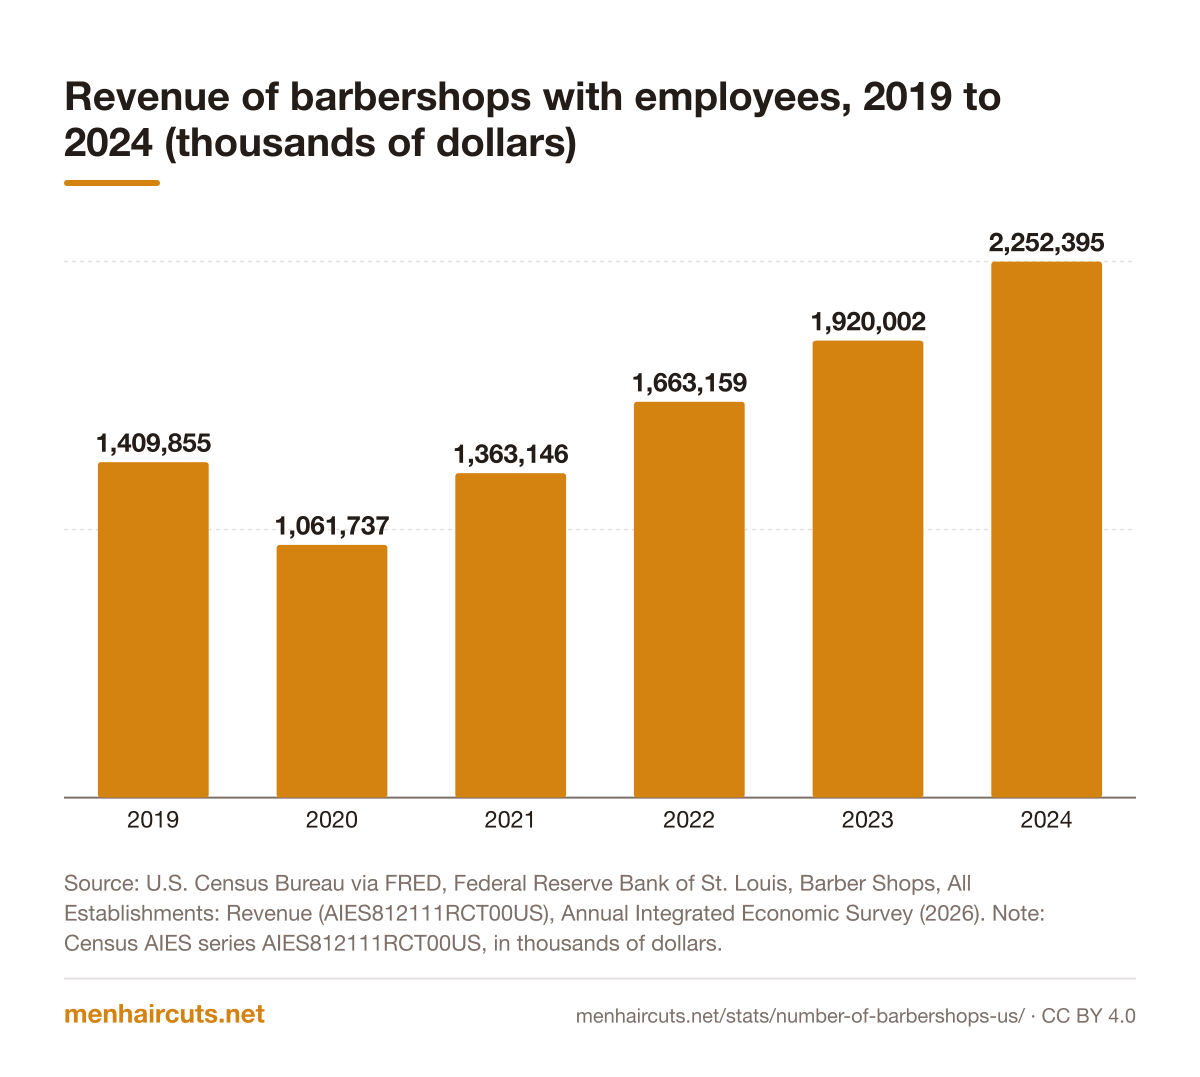
Show the numbers
| Category | Value |
|---|---|
| 2019 | 1,409,855 |
| 2020 | 1,061,737 |
| 2021 | 1,363,146 |
| 2022 | 1,663,159 |
| 2023 | 1,920,002 |
| 2024 | 2,252,395 |
How many barbers work in barbershops?
The BLS counts 75,800 barber jobs in 2025, and 60,600 of them, 79.9%, are self-employed[8]. About 14,900 barbers are on payrolls in personal care services, the industry group that includes barbershops[8].
Barbershops with employees averaged 35,340 workers in 2025, a figure that includes receptionists, managers and other staff as well as barbers[3]. For how to choose among all these shops, see how to find a good barber.
Frequently asked questions
How many barbershops are in the US in 2026?
Which state has the most barbershops?
Is the barbershop industry growing?
How many employees does a typical barbershop have?
How much revenue do US barbershops make?
Methodology and limitations
Barbershop counts come from Census Bureau datasets for NAICS 812111 Barber Shops, read from data.census.gov: Nonemployer Statistics for 2019, 2021, 2022, 2023 and 2024, and County Business Patterns 2023 for employer establishments, employees, payroll, size class and legal form. Yearly employer counts for 2014 to 2025 come from BLS QCEW annual averages for private establishments. Employer revenue comes from the Census Annual Integrated Economic Survey via FRED. Combined totals, shares, averages and growth rates are menhaircuts.net calculations with the formula shown. Dollar amounts in prose are rounded from Census values published in thousands. Data accessed October 15, 2026.
Limitations
Nonemployer and employer counts come from different programs and years (2024 and 2023), so the combined total is approximate. A nonemployer business is a tax filer, not a storefront; chair renters inside one shop can each be counted. Census changed nonemployer methods in 2022, limiting comparisons with earlier years. CBP and QCEW define and count establishments differently, which is why their 2023 employer counts differ (7,789 vs 7,728). Shops classified as beauty salons that also cut men's hair are not included.
Every figure on this page links to its source. Numbers are reported as published; any menhaircuts.net calculation is labelled and shows its inputs. Spotted an error? Tell us and we will check it.
Sources
- Nonemployer Statistics 2024 (NS00NONEMP), NAICS 812111 Barber Shops, U.S. Census Bureau (2026). Accessed October 15, 2026.
- County Business Patterns 2023 (CB2300CBP), NAICS 812111 Barber shops, U.S. Census Bureau (2025). Accessed October 15, 2026.
- QCEW open data: NAICS 812111 Barber shops, 2025 annual averages (private ownership), U.S. Bureau of Labor Statistics, Quarterly Census of Employment and Wages (2026). Accessed October 15, 2026.
- Nonemployer Statistics 2019, 2021, 2022 and 2023, NAICS 812111 Barber Shops (e.g. NS2300NONEMP), U.S. Census Bureau (2025). Accessed October 15, 2026.
- QCEW open data: NAICS 812111 Barber shops, annual averages 2014-2024 (one file per year, e.g. 2024), U.S. Bureau of Labor Statistics, Quarterly Census of Employment and Wages (2025). Accessed October 15, 2026.
- Barber Shops, All Establishments: Revenue (AIES812111RCT00US), Annual Integrated Economic Survey, U.S. Census Bureau via FRED, Federal Reserve Bank of St. Louis (2026). Accessed October 15, 2026.
- QCEW open data: NAICS 812112 Beauty salons, 2025 annual averages, U.S. Bureau of Labor Statistics, Quarterly Census of Employment and Wages (2026). Accessed October 15, 2026.
- National Employment Matrix, occupation 39-5011 Barbers, 2025 and projected 2035, U.S. Bureau of Labor Statistics (2026). Accessed October 15, 2026.
Cite, embed and download
This report, its charts and its infographic are free to reuse under a Creative Commons Attribution 4.0 license. Credit menhaircuts.net with a link to this page.
Cite this report (APA)
Hamilton, J. (2026, October 15). How Many Barbershops Are in the US? 2026 Census Data. menhaircuts.net. https://menhaircuts.net/stats/number-of-barbershops-us/
Link to this report
<a href="https://menhaircuts.net/stats/number-of-barbershops-us/">How Many Barbershops Are in the US? 2026 Census Data</a> (menhaircuts.net, CC BY 4.0)Share the headline number
154,456: Barbershops with no employees (nonemployer), 2024 (U.S. Census Bureau, via menhaircuts.net/stats/number-of-barbershops-us/)
Download the charts and infographic
- US barbershops by type (PNG)
- Private barbershops with employees, 2014 to 2025 (PNG)
- States with the most barbershops (nonemployer 2024 + employer 2023) (PNG)
- Nonemployer barbershops by annual receipts, 2024 (PNG)
- Employer establishments, 2023: barbershops vs beauty salons (PNG)
- Revenue of barbershops with employees, 2019 to 2024 (thousands of dollars) (PNG)
- Infographic: How Many Barbershops Are in the US? 2026 Census Data (PNG, 1000 x 1500)
Related data
- 75,800Barber jobs in the US, 2025 (including self-employed)Barber Industry Statistics 2026
- $38,210Median annual wage for barbers, May 2025Barber Salary by State 2026
- $43Average barbershop haircut, SQUIRE data May 2025 to April 2026Barbershop vs Salon vs Chain Prices 2026
- ~2 in 3Barbershop bookings made by clients through self-serviceBarbershop Booking Statistics 2026
Related guides
Make us a Preferred Source on Google
See our latest articles first in your Google Search & AI Overviews.