
Data report · Updated October 2026
Barber industry statistics: 75,800 barber jobs, and 4 in 5 barbers work for themselves
Jobs, pay, shops, revenue, customers and outlook for US barbering, from BLS, Census and booking data.
The US had 75,800 barber jobs in 2025, and 79.9% of them were self-employed[1]. Barbershops took in about $7.3 billion in 2024: $5.07 billion at one-person shops and $2.25 billion at shops with staff[2][3]. BLS projects 3.3% job growth through 2035[4].

75,800
Barber jobs in the US, 2025 (including self-employed)[4]
79.9%
Share of barbers who are self-employed[1]
$7.3 billion
Barbershop revenue, 2024 (menhaircuts.net calculation)[2]
$38,210
Median annual wage for payroll barbers, May 2025[5]
$43
Average barbershop haircut price on SQUIRE, 2025 to 2026[6]
By Jessica Hamilton, Editor · Published · Updated · Free to reuse with credit (CC BY 4.0)
Key findings
- Barbers held 75,800 jobs in 2025, and BLS projects 78,300 by 2035, a 3.3% increase with about 6,900 openings a year[4].
- Self-employed barbers held 60,600 jobs, 79.9% of the total, in 2025[1].
- The US had 154,456 nonemployer barbershops in 2024 and 7,789 barbershops with employees in 2023[2][7].
- Barbershop revenue reached about $7.32 billion in 2024, combining $5.07 billion at nonemployer shops and $2.25 billion at employer shops (menhaircuts.net calculation)[2][3].
- Payroll barbers earned a median $38,210 and a mean $47,070 in May 2025[5].
- Women made up 22.1% of barbers in 2024, and 41.8% of barbers were Hispanic[8].
- On the SQUIRE platform, 44.63% of visits came from returning clients, who came back every 48.5 days on average[6].
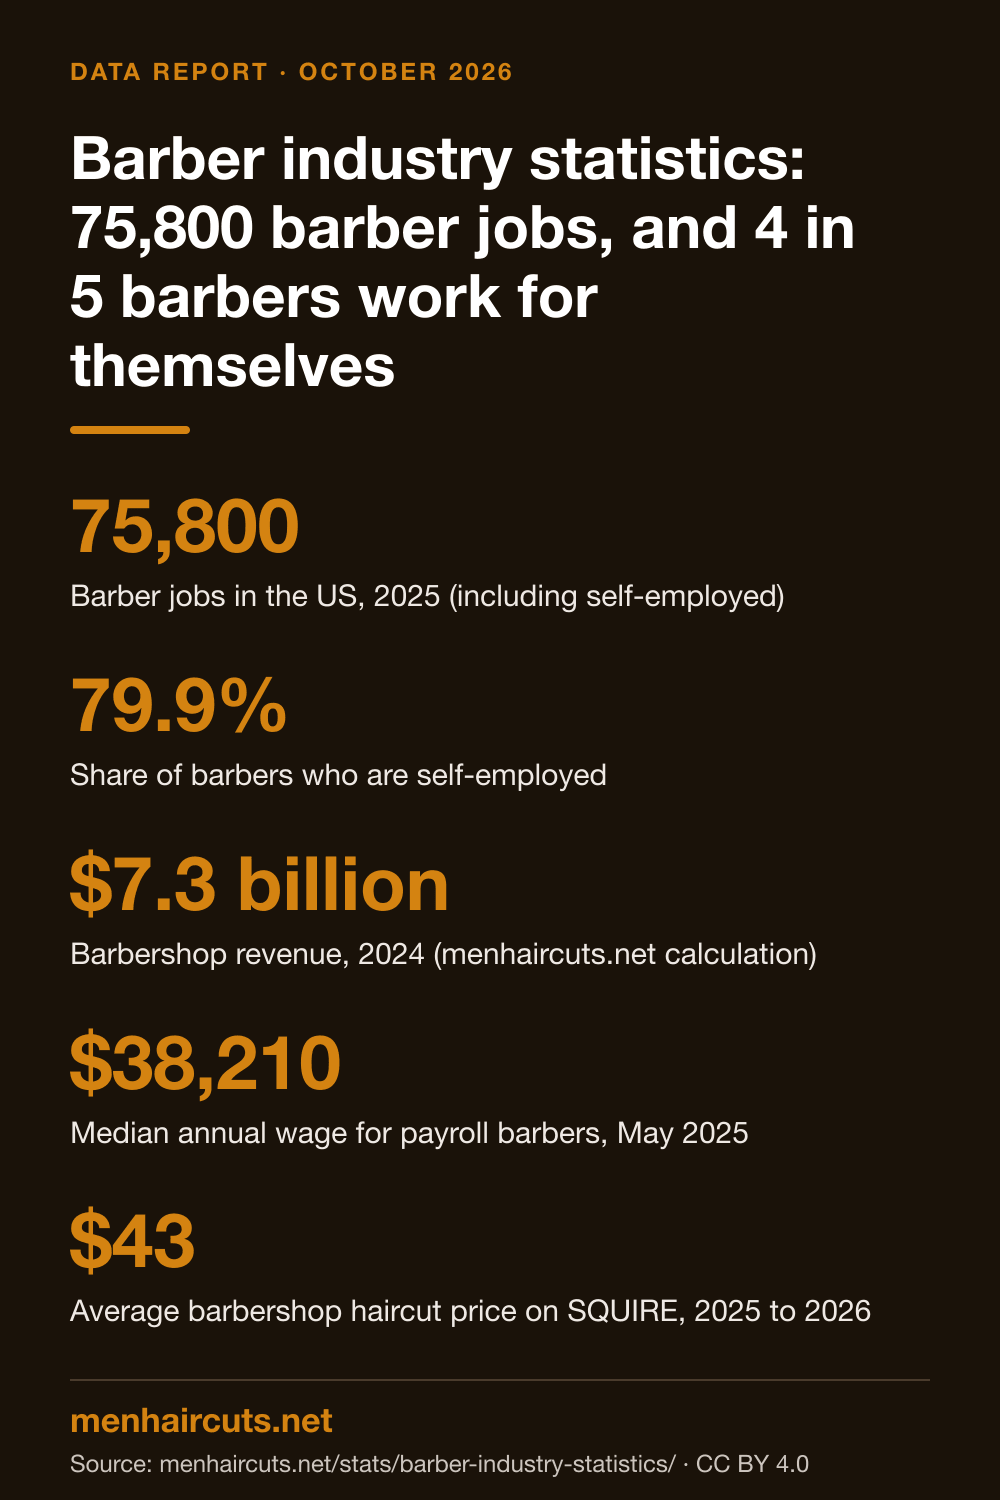
Download the infographic
The headline numbers from this report as one tall image (1000 x 1500 PNG), sized for Pinterest, slides and posts. Free to reuse with credit.
How big is the barber industry in the US?
Barbering is a small-business trade. The Census Bureau counted 154,456 barbershops with no paid employees in 2024, almost all of them sole proprietors, and those businesses reported $5.07 billion in receipts[2]. Barbershops with employees, 7,789 locations in 2023, are a much smaller group[7], and they brought in $2.25 billion in revenue in 2024[3].
Combined, barbershop revenue was about $7.32 billion in 2024 (menhaircuts.net calculation: $5,070,906,000 + $2,252,395,000). Both figures are for 2024 and both come from the Census Bureau, though from two different programs. Shops that call themselves salons but cut men's hair are counted as beauty salons and are not included.
Revenue at employer barbershops has grown quickly: from $1.41 billion in 2019 to $2.25 billion in 2024, a 59.8% rise (menhaircuts.net calculation: ($2,252,395 - $1,409,855) / $1,409,855, in thousands)[3].
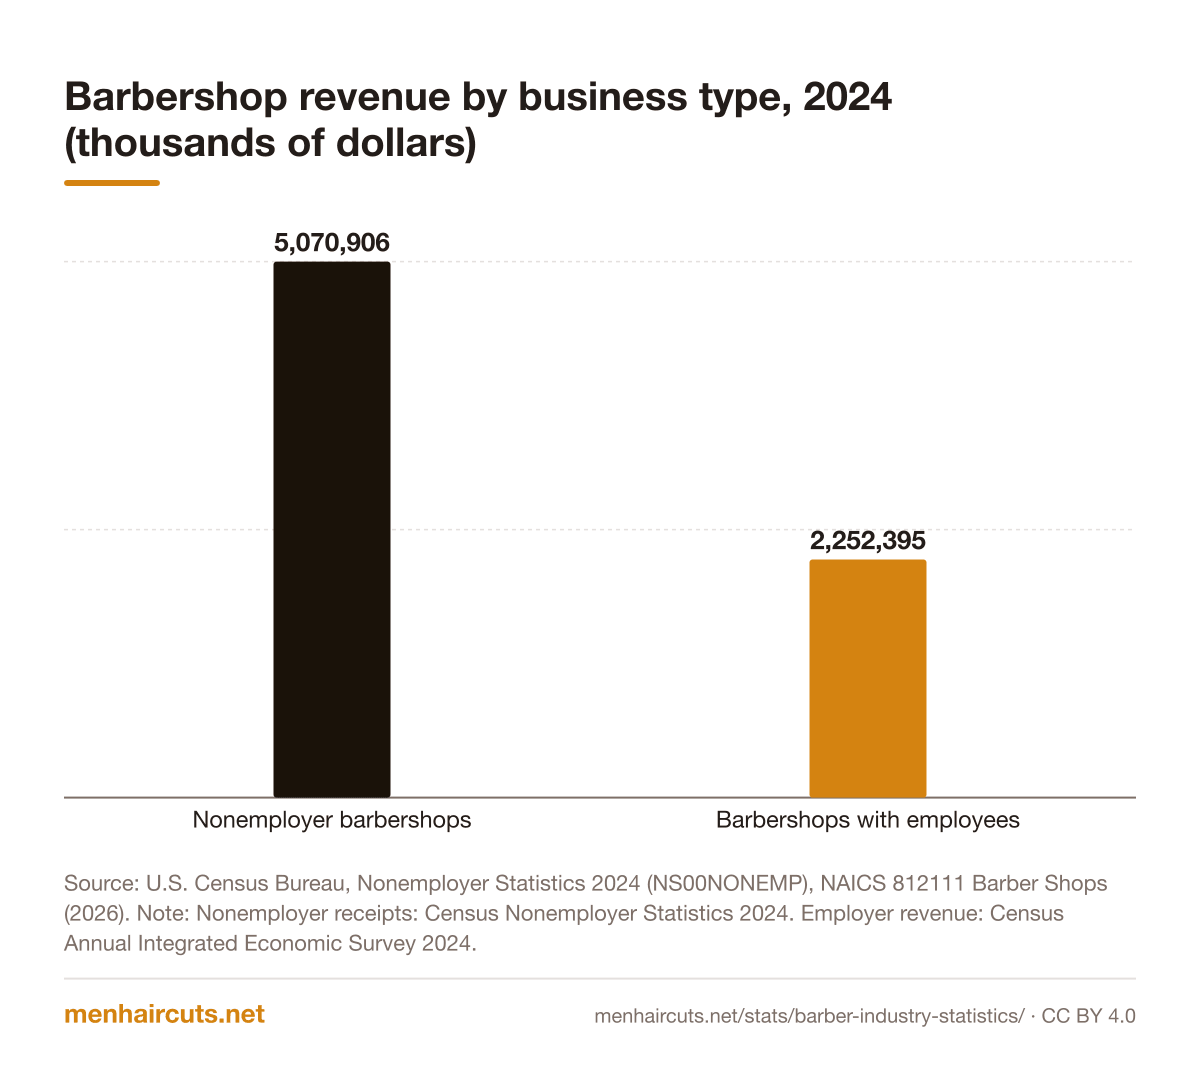
Show the numbers
| Category | Value |
|---|---|
| Nonemployer barbershops | 5,070,906 |
| Barbershops with employees | 2,252,395 |
How many barbers are there in the US?
It depends on who is counting. The BLS Employment Projections program, which includes the self-employed, puts barber jobs at 75,800 in 2025[4]. The Census Bureau's American Community Survey, summarized by Data USA, counted a barber workforce of 80,891 people in 2024[8]. Both land in the same range.
The BLS wage survey counts only 15,000 barbers, because it covers payroll jobs only[5]. That gap is the clearest sign of how the trade works: 60,600 of the 75,800 barber jobs, or 79.9%, are self-employed, compared with 15,200 wage and salary jobs[1]. Most of the payroll jobs, 14,900, are in personal care services, the industry that includes barbershops[1].
Barbers are a small slice of the wider hair trade. Hairdressers, hairstylists and cosmetologists held 595,000 jobs in 2025, nearly eight times as many as barbers[4].
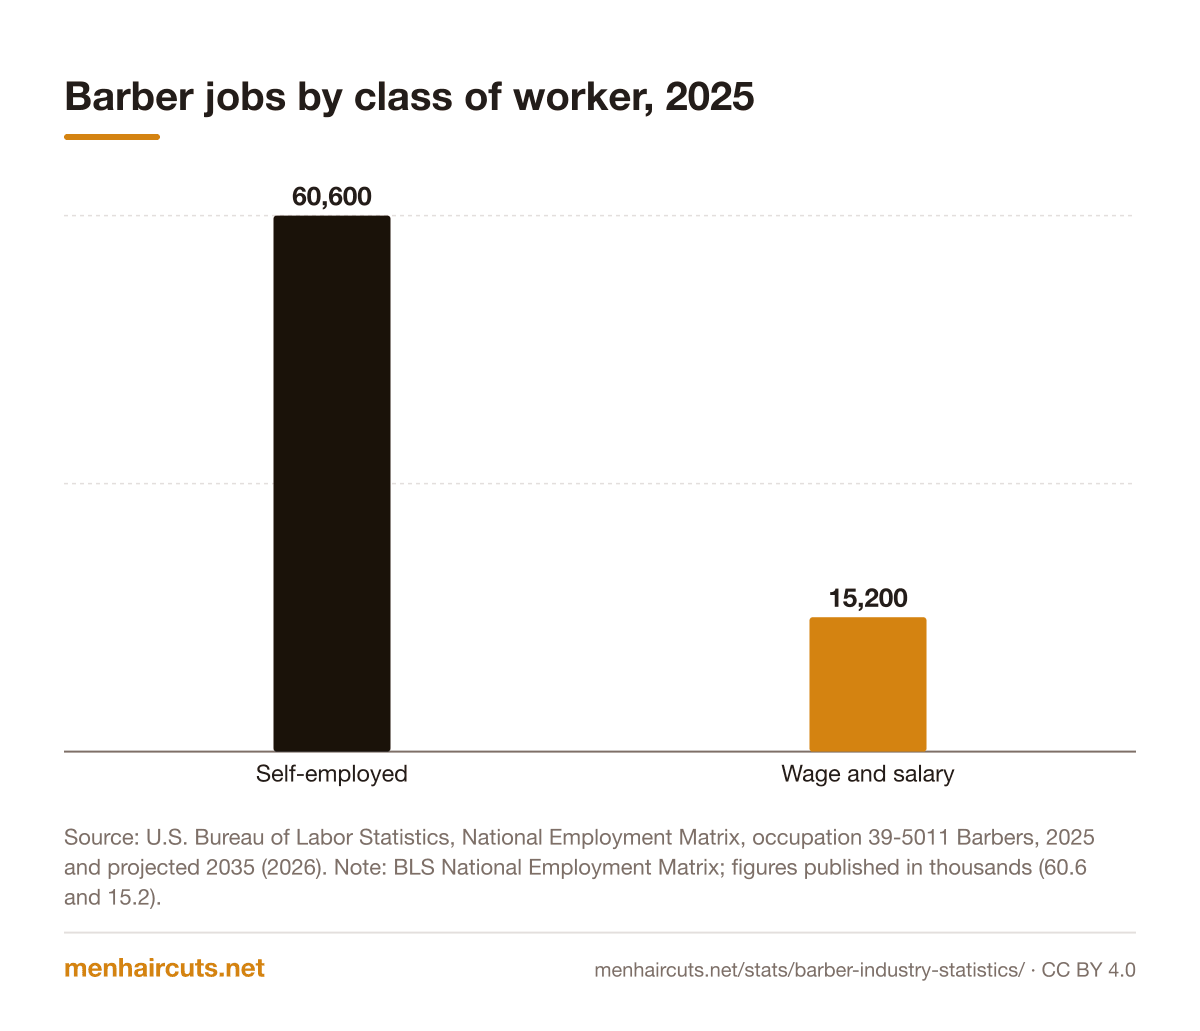
Show the numbers
| Category | Value |
|---|---|
| Self-employed | 60,600 |
| Wage and salary | 15,200 |
Is barbering a growing industry?
Modestly. BLS projects barber jobs to rise from 75,800 in 2025 to 78,300 in 2035, an increase of 2,500 or 3.3%, close to the 3.5% projected for all occupations[4]. The agency expects about 6,900 openings for barbers each year over the decade, most from people retiring or leaving the trade[4].
The growth is concentrated in payroll jobs. Wage and salary barber jobs are projected to grow 8.8%, to 16,600, while self-employed barber jobs grow 1.9%, to 61,800[1]. Related personal appearance jobs are projected to grow faster: 7.7% for hairdressers and cosmetologists and 9.2% for manicurists and pedicurists[4].
Business counts are growing faster than jobs. Employer barbershops rose from 5,926 in 2019 to 8,547 in 2025 by the BLS QCEW count, and nonemployer barbershops from 116,128 in 2019 to 154,456 in 2024[9][10][11][2].
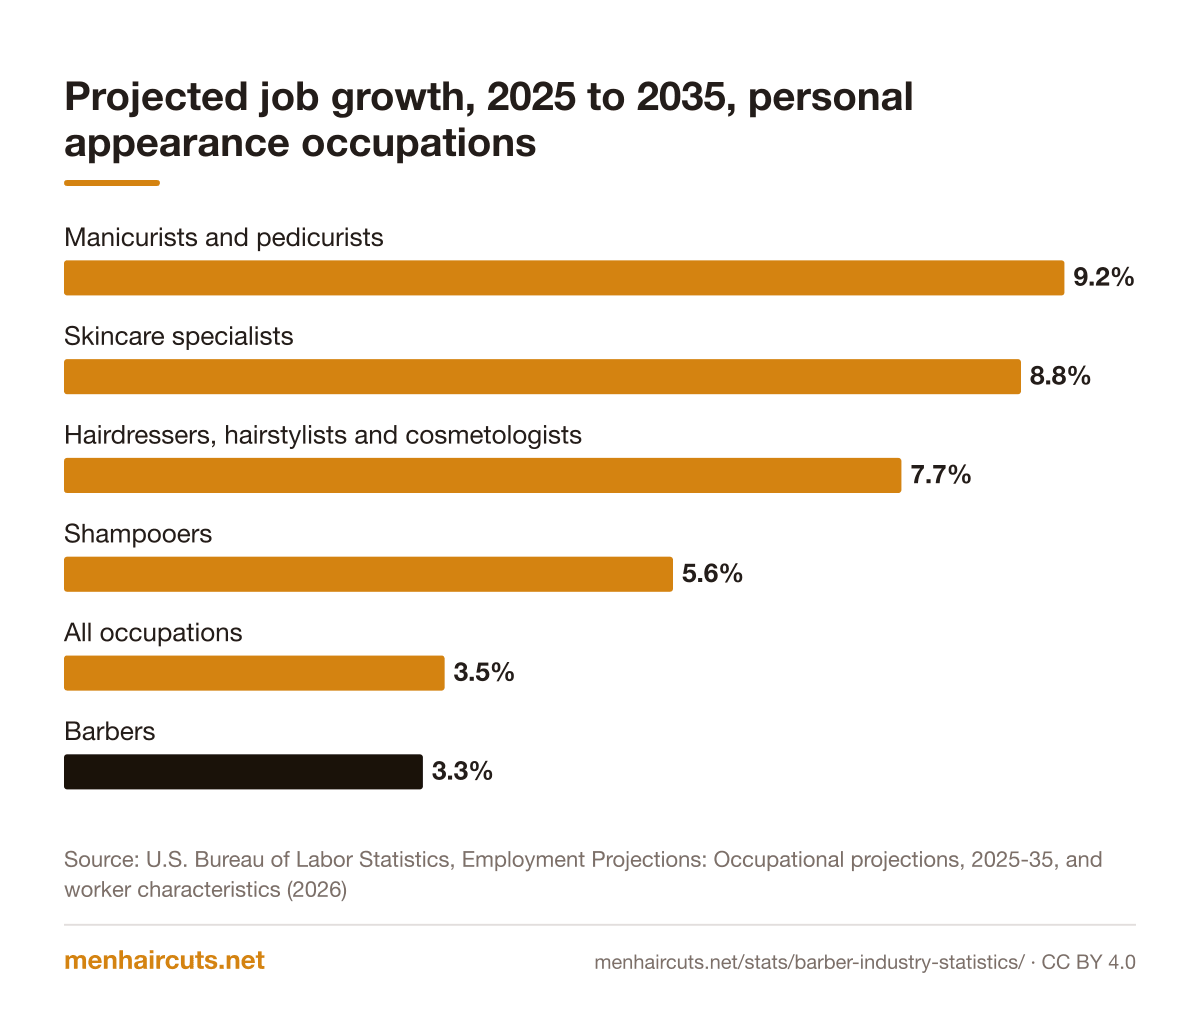
Show the numbers
| Category | Value |
|---|---|
| Manicurists and pedicurists | 9.2% |
| Skincare specialists | 8.8% |
| Hairdressers, hairstylists and cosmetologists | 7.7% |
| Shampooers | 5.6% |
| All occupations | 3.5% |
| Barbers | 3.3% |
How much do barbers make?
Payroll barbers earned a median $38,210 a year, or $18.37 an hour, in May 2025; the mean was $47,070[5]. The top 10% earned at least $76,460[5]. Pay varies widely by state, from a mean of $83,650 in Oregon to $25,890 in Utah[5].
Barbershops with employees paid an average of $39,421 a year per employee in 2025, according to employer tax records[10]. The full state-by-state breakdown is in our barber salary by state report.
| Measure | Figure | Year | Source |
|---|---|---|---|
| Barber jobs (incl. self-employed) | 75,800 | 2025 | BLS Employment Projections |
| Self-employed share | 79.9% | 2025 | BLS National Employment Matrix |
| Barbers on payrolls | 15,000 | May 2025 | BLS OEWS |
| Median annual wage, payroll barbers | $38,210 | May 2025 | BLS OEWS |
| Nonemployer barbershops | 154,456 | 2024 | Census Nonemployer Statistics |
| Barbershops with employees | 7,789 | 2023 | Census County Business Patterns |
| Nonemployer barbershop receipts | $5,070,906,000 | 2024 | Census Nonemployer Statistics |
| Employer barbershop revenue | $2,252,395,000 | 2024 | Census AIES |
| Projected job growth | 3.3% | 2025 to 2035 | BLS Employment Projections |
Who are America's barbers?
Barbering is mostly male, but less so than it once was. Women were 22.1% of the barber workforce in 2024 and men 77.9%[8]. The average barber was 39 years old: 38.5 for men and 40.6 for women[8].
The trade is diverse. In 2024, 41.8% of barbers were Hispanic; by race, 35.9% were White, 21.7% Black and 19.2% two or more races[8]. Most barbers enter through a barber school certificate; BLS lists a postsecondary nondegree award as the typical entry-level education[4]. Licensing rules vary by state, as our barber license requirements report shows.
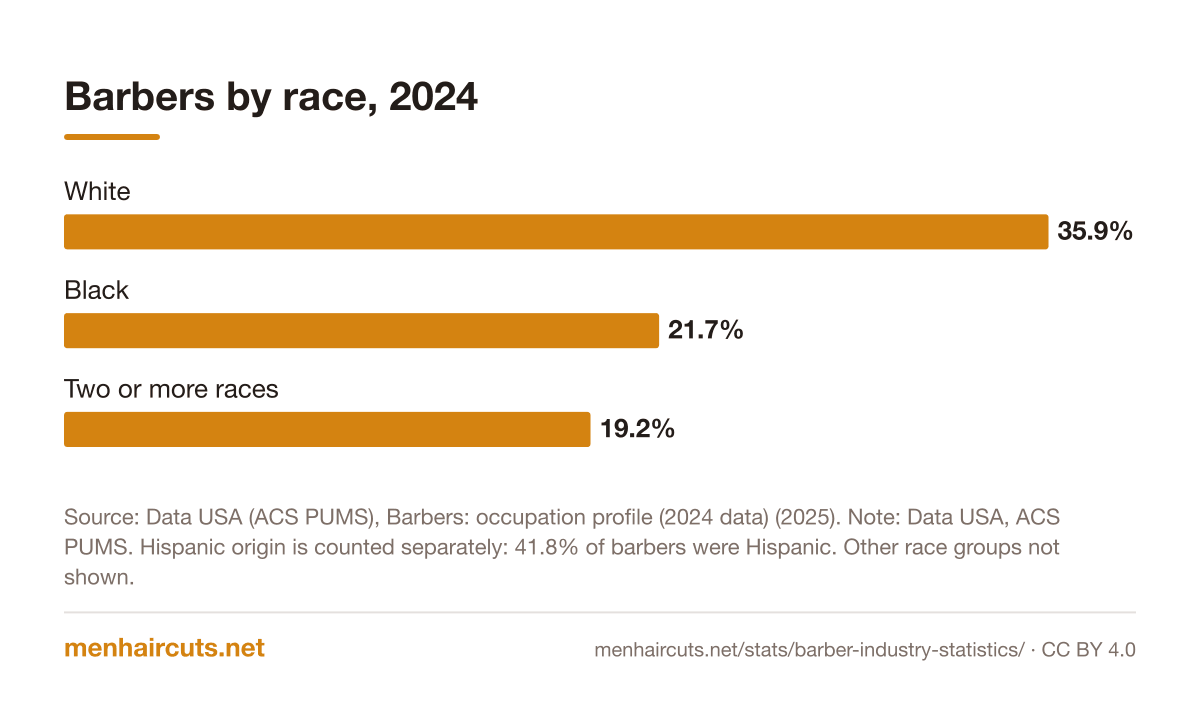
Show the numbers
| Category | Value |
|---|---|
| White | 35.9% |
| Black | 21.7% |
| Two or more races | 19.2% |
How much does a barbershop haircut cost?
Across SQUIRE's shops, the average haircut cost $43 between May 2025 and April 2026, before tax and tip[6]. Prices were highest in the West at $45, $40 in the Northeast and South, and lowest in the Midwest at $35[6]. SQUIRE's sample covered about 7,000 US shops and 13.9 million appointments[6].
Tipping is part of the price in practice. Average tips on SQUIRE ran from 20% in the Northeast to 23% in the South and Midwest[6]. See how much to tip your barber and how much a haircut costs for more.
| Region | Average cut price | Average tip | Retention rate | Schedule utilization |
|---|---|---|---|---|
| Northeast | $40 | 20% | 47.04% | 69% |
| South | $40 | 23% | 44.99% | 60% |
| Midwest | $35 | 23% | 48.77% | 66% |
| West | $45 | 21% | 40.60% | 59% |
How loyal are barbershop customers?
Repeat business carries the trade. On SQUIRE, 44.63% of visits came from a client who had been to that shop before, and returning clients came back every 48.5 days on average[6]. About 48% of clients booked only once in the period[6]. A barber on the platform averaged 94.2 appointments a month, and chairs were filled 62% of available time[6].
Online reputation is close to universal. In a SQUIRE review of Google ratings for 17,913 shops in the 25 largest US metros, 83% rated 4.5 stars or higher and 37% rated 4.9 to 5.0; only 2% fell below 4.0[6]. More on booking habits is in our barbershop booking statistics.
Where are the most barbers and barbershops?
Texas has the most barbers on payrolls, 2,580, followed by California (1,390), Florida (1,240), Washington (1,220) and Missouri (580)[5]. Dallas-Fort Worth-Arlington is the metro area with the most payroll barbers, 790, ahead of Houston with 630[5].
Counting businesses, California (18,036) and Texas (18,016) have the most nonemployer barbershops, followed by Florida (16,492), New York (10,143) and Georgia (8,125)[2]. New York has the most barbershops with employees, 1,000 in 2023[7]. Our number of barbershops report lists every state.
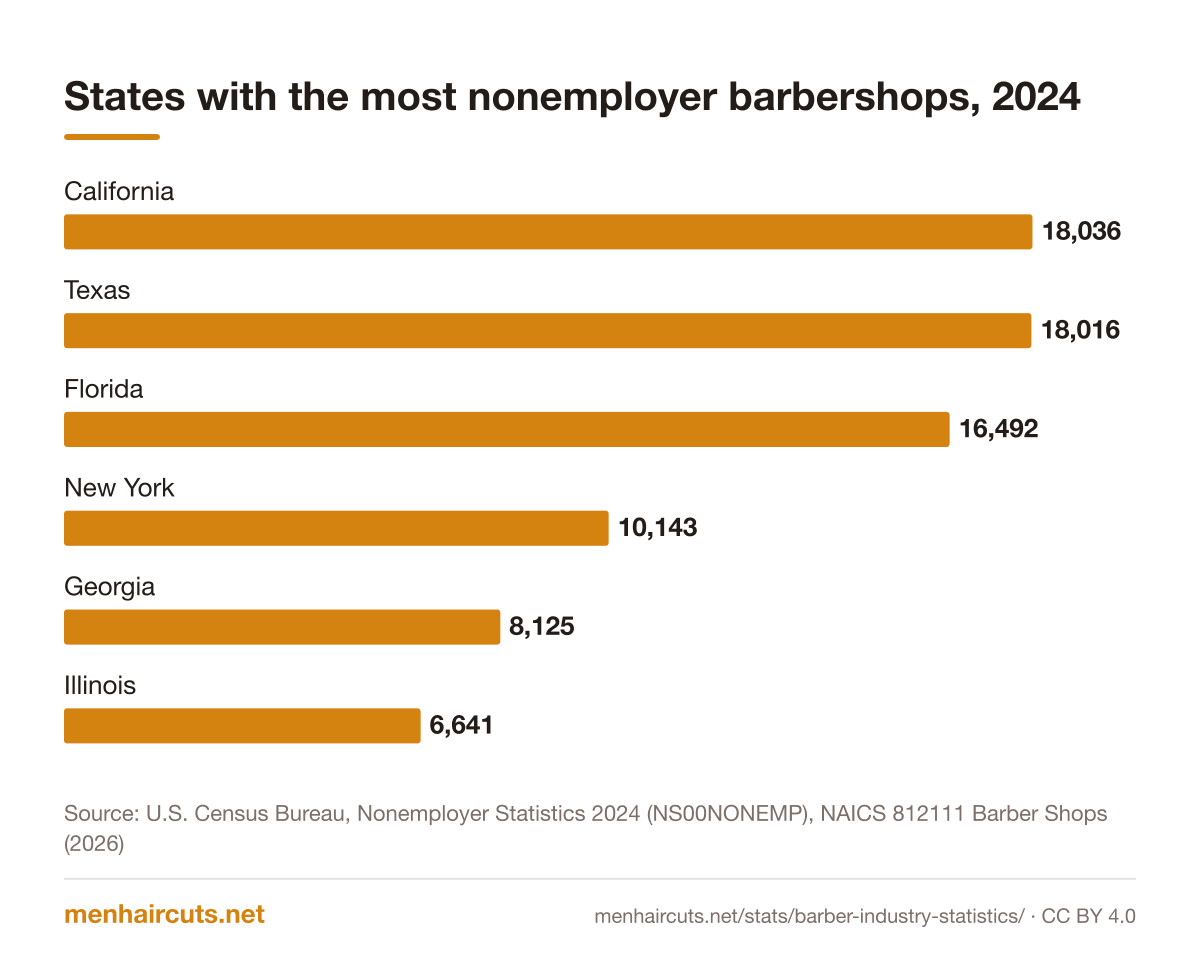
Show the numbers
| Category | Value |
|---|---|
| California | 18,036 |
| Texas | 18,016 |
| Florida | 16,492 |
| New York | 10,143 |
| Georgia | 8,125 |
| Illinois | 6,641 |
Frequently asked questions
How many barbers are in the US?
How much is the US barbershop industry worth?
What percentage of barbers are self-employed?
Is the barber industry growing?
What percentage of barbers are women?
How many barbershops are in the US?
What is the average price of a barbershop haircut?
Methodology and limitations
Jobs, self-employment and projections come from the BLS Employment Projections 2025 to 2035 tables and National Employment Matrix for SOC 39-5011. Wages and state and metro employment come from BLS OEWS May 2025. Business counts and revenue come from Census Nonemployer Statistics (2019 to 2024), County Business Patterns 2023 and the Annual Integrated Economic Survey (via FRED) for NAICS 812111, plus BLS QCEW establishment counts. Demographics come from Data USA's summary of 2024 American Community Survey microdata. Prices, tips, retention and reviews come from SQUIRE's State of Barbershops 2026 report (data May 2025 to April 2026). Sums and percent changes are menhaircuts.net calculations; dollar amounts in prose are rounded from Census values published in thousands. Accessed October 15, 2026.
Limitations
Job counts differ by source because of different definitions (jobs vs people, payroll vs all workers). Census business counts count tax filers, so booth renters can appear as separate businesses. Revenue figures exclude barbers working in beauty salons. SQUIRE data reflects shops on one booking platform, which may skew toward busier, appointment-based shops in larger markets. Data USA demographic estimates come from a sample survey and have margins of error.
Every figure on this page links to its source. Numbers are reported as published; any menhaircuts.net calculation is labelled and shows its inputs. Spotted an error? Tell us and we will check it.
Sources
- National Employment Matrix, occupation 39-5011 Barbers, 2025 and projected 2035, U.S. Bureau of Labor Statistics (2026). Accessed October 15, 2026.
- Nonemployer Statistics 2024 (NS00NONEMP), NAICS 812111 Barber Shops, U.S. Census Bureau (2026). Accessed October 15, 2026.
- Barber Shops, All Establishments: Revenue (AIES812111RCT00US), Annual Integrated Economic Survey, U.S. Census Bureau via FRED, Federal Reserve Bank of St. Louis (2026). Accessed October 15, 2026.
- Employment Projections: Occupational projections, 2025-35, and worker characteristics, U.S. Bureau of Labor Statistics (2026). Accessed October 15, 2026.
- OEWS Profiles: Barbers (39-5011), May 2025 national, state, metro and industry estimates, U.S. Bureau of Labor Statistics (2026). Accessed October 15, 2026.
- The State of Barbershops 2026: SQUIRE Barber Trends and Insights Report, SQUIRE (2026). Accessed October 15, 2026.
- County Business Patterns 2023 (CB2300CBP), NAICS 812111 Barber shops, U.S. Census Bureau (2025). Accessed October 15, 2026.
- Barbers: occupation profile (2024 data), Data USA (ACS PUMS) (2025). Accessed October 15, 2026.
- QCEW open data: NAICS 812111 Barber shops, annual averages 2014-2024 (one file per year, e.g. 2024), U.S. Bureau of Labor Statistics, Quarterly Census of Employment and Wages (2025). Accessed October 15, 2026.
- QCEW open data: NAICS 812111 Barber shops, 2025 annual averages (private ownership), U.S. Bureau of Labor Statistics, Quarterly Census of Employment and Wages (2026). Accessed October 15, 2026.
- Nonemployer Statistics 2019, 2021, 2022 and 2023, NAICS 812111 Barber Shops (e.g. NS2300NONEMP), U.S. Census Bureau (2025). Accessed October 15, 2026.
Cite, embed and download
This report, its charts and its infographic are free to reuse under a Creative Commons Attribution 4.0 license. Credit menhaircuts.net with a link to this page.
Cite this report (APA)
Hamilton, J. (2026, October 15). Barber Industry Statistics 2026: Jobs, Shops and Revenue. menhaircuts.net. https://menhaircuts.net/stats/barber-industry-statistics/
Link to this report
<a href="https://menhaircuts.net/stats/barber-industry-statistics/">Barber Industry Statistics 2026: Jobs, Shops and Revenue</a> (menhaircuts.net, CC BY 4.0)Share the headline number
75,800: Barber jobs in the US, 2025 (including self-employed) (U.S. Bureau of Labor Statistics, via menhaircuts.net/stats/barber-industry-statistics/)
Download the charts and infographic
- Barbershop revenue by business type, 2024 (thousands of dollars) (PNG)
- Barber jobs by class of worker, 2025 (PNG)
- Projected job growth, 2025 to 2035, personal appearance occupations (PNG)
- Barbers by race, 2024 (PNG)
- States with the most nonemployer barbershops, 2024 (PNG)
- Infographic: Barber Industry Statistics 2026 (PNG, 1000 x 1500)
Related data
- $38,210Median annual wage for barbers, May 2025Barber Salary by State 2026
- 154,456Barbershops with no employees (nonemployer), 2024How Many Barbershops Are in the US? 2026 Census Data
- 1,500Most common school-hour requirement among verified statesBarber License Requirements by State 2026
- ~2 in 3Barbershop bookings made by clients through self-serviceBarbershop Booking Statistics 2026
Related guides
Make us a Preferred Source on Google
See our latest articles first in your Google Search & AI Overviews.